Bitcoin Price Analysis April 30: BTC Steady But Fragile, Tight Range Ahead Of The Next Major Move
Since our previous Bitcoin price analysis, nothing much had changed in the bigger picture, as the coin still trading inside the tight range between $5000 and $5200.
It looks like the market is searching for its direction, getting ready for its the next big move. The crypto world is still under the unclear situation coming out from BitFinex and Tether, whereas anything might happen from this side.
Another thing to notice is the BTC dominance, which is on the rise since its 50% 2019 low.The primary reason for this is the largest altcoins such as Ethereum and Ripple, which are continuously dropping.
Total Market Cap: $170.4 Billion
Bitcoin Market Cap: $93.2 Billion
BTC Dominance: 54.6%
Looking at the 1-day & 4-hour charts
– Support/Resistance:
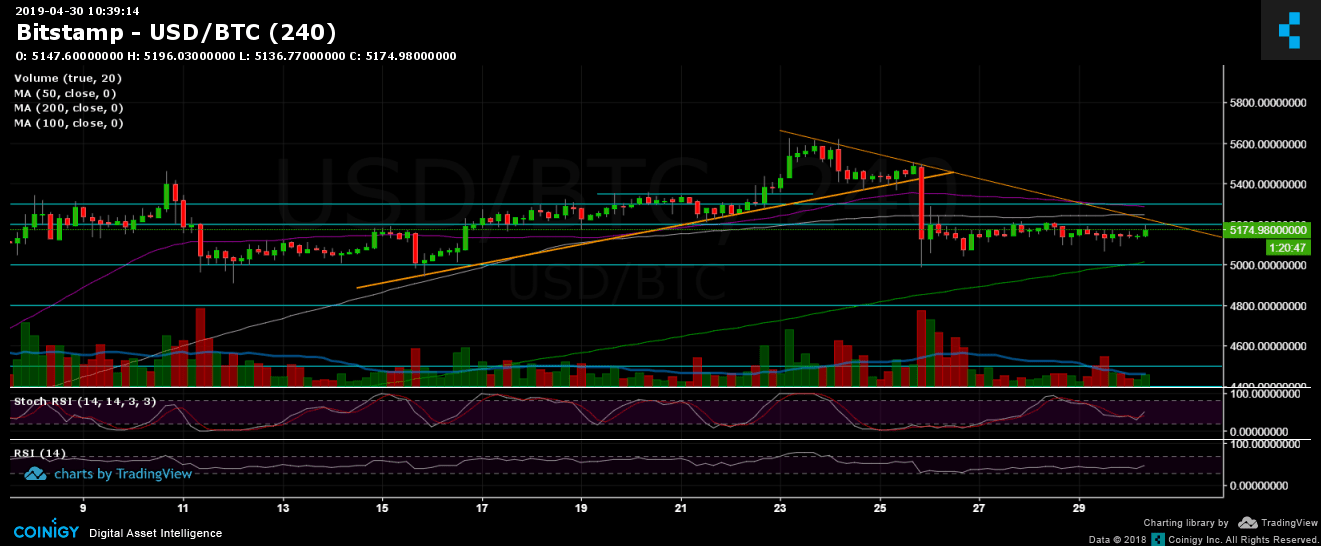
Looking on the 4-hour chart, Bitcoin had recently tested resistance at the descending trend-line for the third time, and getting rejected. This marks $5200 the next significant resistance level. In case of a break-up, we could expect Bitcoin to reach further resistance at $5300 – $5350. Further higher is $5500.
From below, the closest support (weak) lies at $5100, before reaching the significant $5000 support area, along with the 4-hour’s chart MA-200 line (marked in light green). Below is the $4700 – $4800 support area, before reaching the $4500 level.
– Trading Volume: As the volatility decreased over the past days, the volume is very low. Traders are waiting for the next big move.
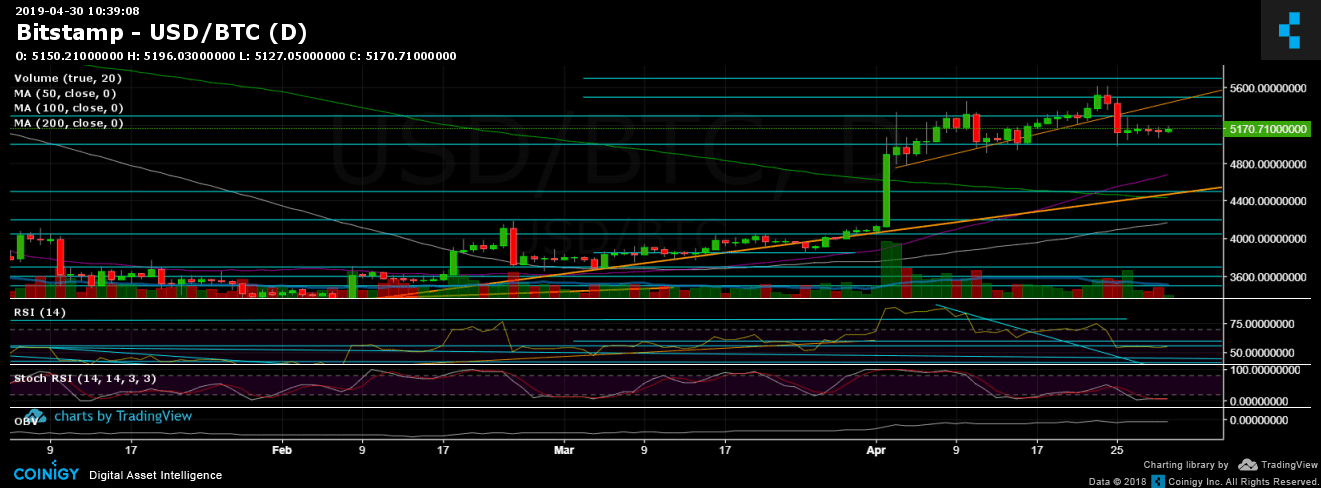
– Daily chart’s RSI: the RSI is still facing tough resistance at 56; the Stochastic RSI is at its oversold levels, about to make a cross over.
– BitFinex open short positions: after reaching its weekly high, the number of short positions decreased a bit – as of now it stands on 29.7K BTC open short positions.
BTC/USD BitStamp 4-Hour Chart

BTC/USD BitStamp 1-Day Chart

The post Bitcoin Price Analysis April 30: BTC Steady But Fragile, Tight Range Ahead Of The Next Major Move appeared first on CryptoPotato.


