Bitcoin Price Analysis April 21: BTC Consolidation For 5 Days – Is It Time For a Sharp Move Now?
Easter, Holidays, and weekend: Over the past three days, Bitcoin had been steady, inside a tight range of $5200 from below and $5350 from above, with not much of an interest.
In our previous analysis, we had mentioned the importance of the $5300 – $5350 resistance area. Bitcoin is trading inside the range for over a day. Some signs are telling about a coming-up sharp move, which will probably take place in the next day or so, following the Easter Holiday.
Another remark to notice is the raising BTC dominance. This could be easily said by looking at the major altcoins, such as Ripple and Ethereum, who suffer from a negative momentum.
Total Market Cap: $180.2 Billion
Bitcoin Market Cap: $94.3 Billion
BTC Dominance: 52.4%
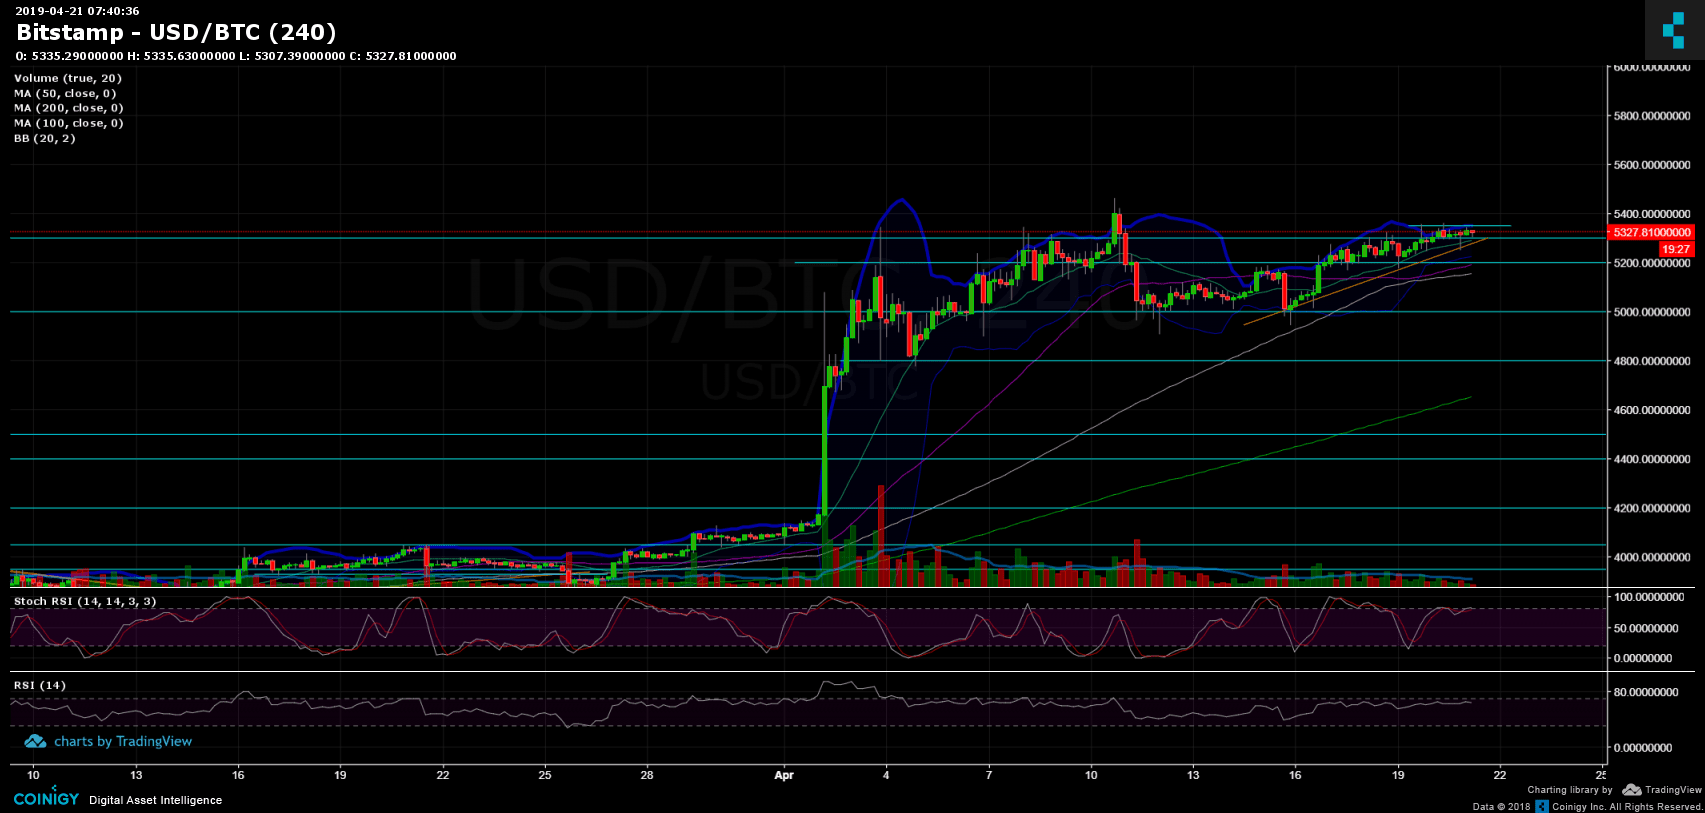
Looking at the 1-day & 4-hour charts
– Coming-up move:
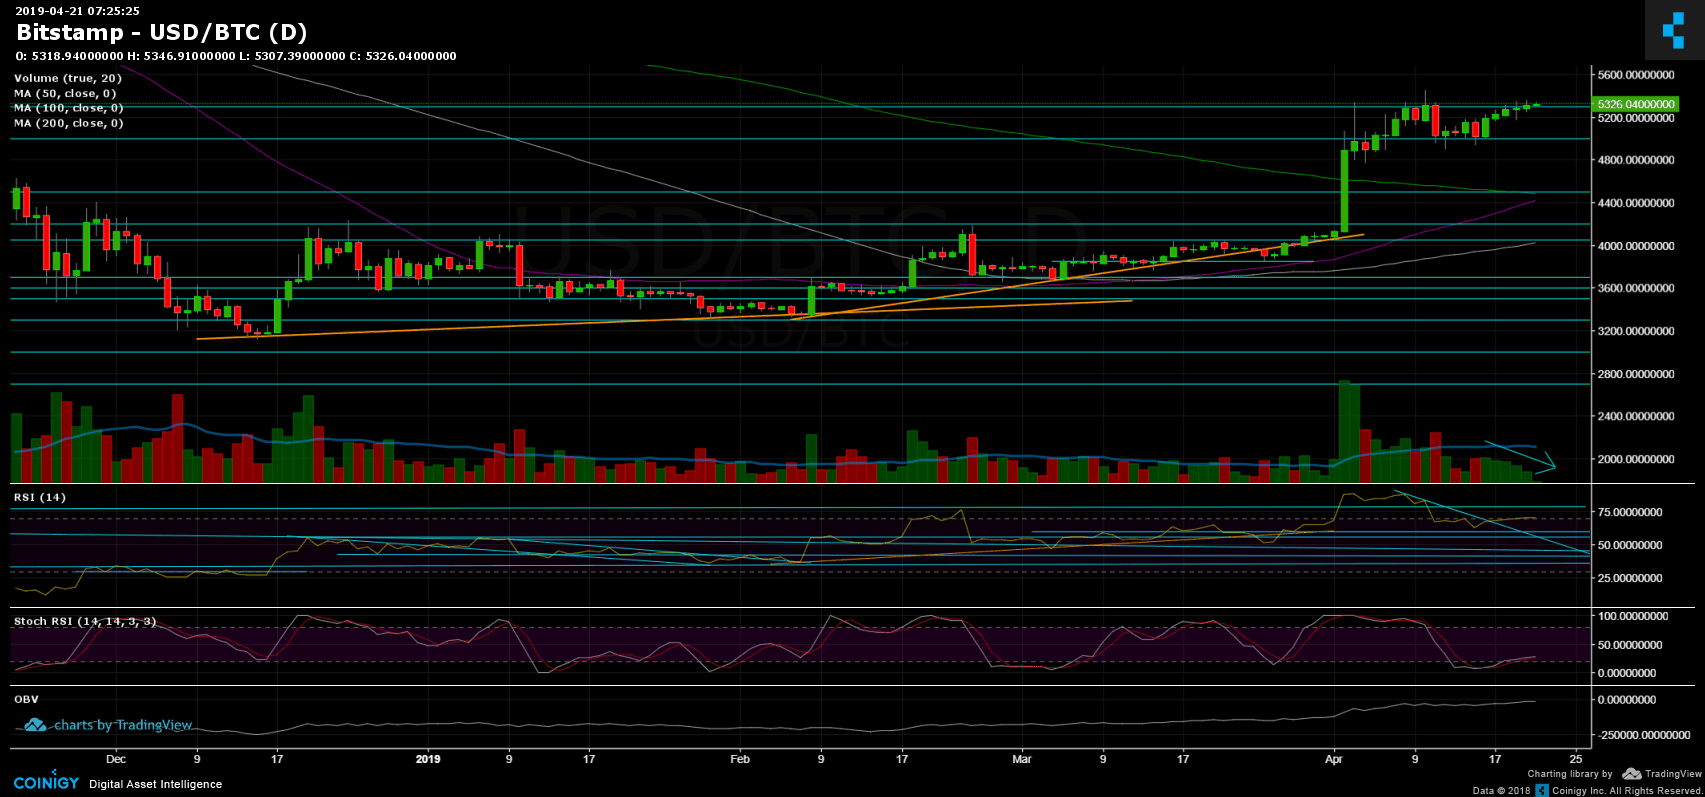
Usually after some consecutive steady days for Bitcoin, a sharp move takes place. This can be said by the tight Bollinger Bands (which are very close to each other) and the fact that the daily volume is declining from day to day (marked by an arrow on the 1-day chart below). What will be the direction of the move? It’s hard to tell at this time of writing.
– Support/Resistance:
Following the break above $5300, the last had become the closest support for Bitcoin. Below lies the $5200 support level (along with MA-50 and MA-100 of the 4-hour chart, marked in purple). Beneath lies the strong $5000 support level. Breaking down the last level could send Bitcoin to retest prior support at $4800 and $4700. Further below is the significant 200-days moving average line (1-day chart) which is currently around $4500.
From above, Bitcoin is not done yet with the $5350 resistance area. In the case of a break-up, the next target is the $5500 level before getting to the 2018 support turned resistance line at $5700 – $5800.
– Daily chart’s RSI: Following our previous analysis, the daily chart’s RSI is still struggling with the 70 RSI levels.
– BitFinex open short positions: the open short positions had increased to 22.3K BTC of open positions.
BTC/USD BitStamp 4-Hour Chart
BTC/USD BitStamp 1-Day Chart
The post Bitcoin Price Analysis April 21: BTC Consolidation For 5 Days – Is It Time For a Sharp Move Now? appeared first on CryptoPotato.