Bitcoin Price Analysis April 18: BTC Is Facing $5300 For The Third Time – What’s Coming Up Next?
Since our previous analysis, we got another proof that the demand around $5000 is quite substantial: For the past 12 days and since breaking up, Bitcoin held firmly above the $5000 area.
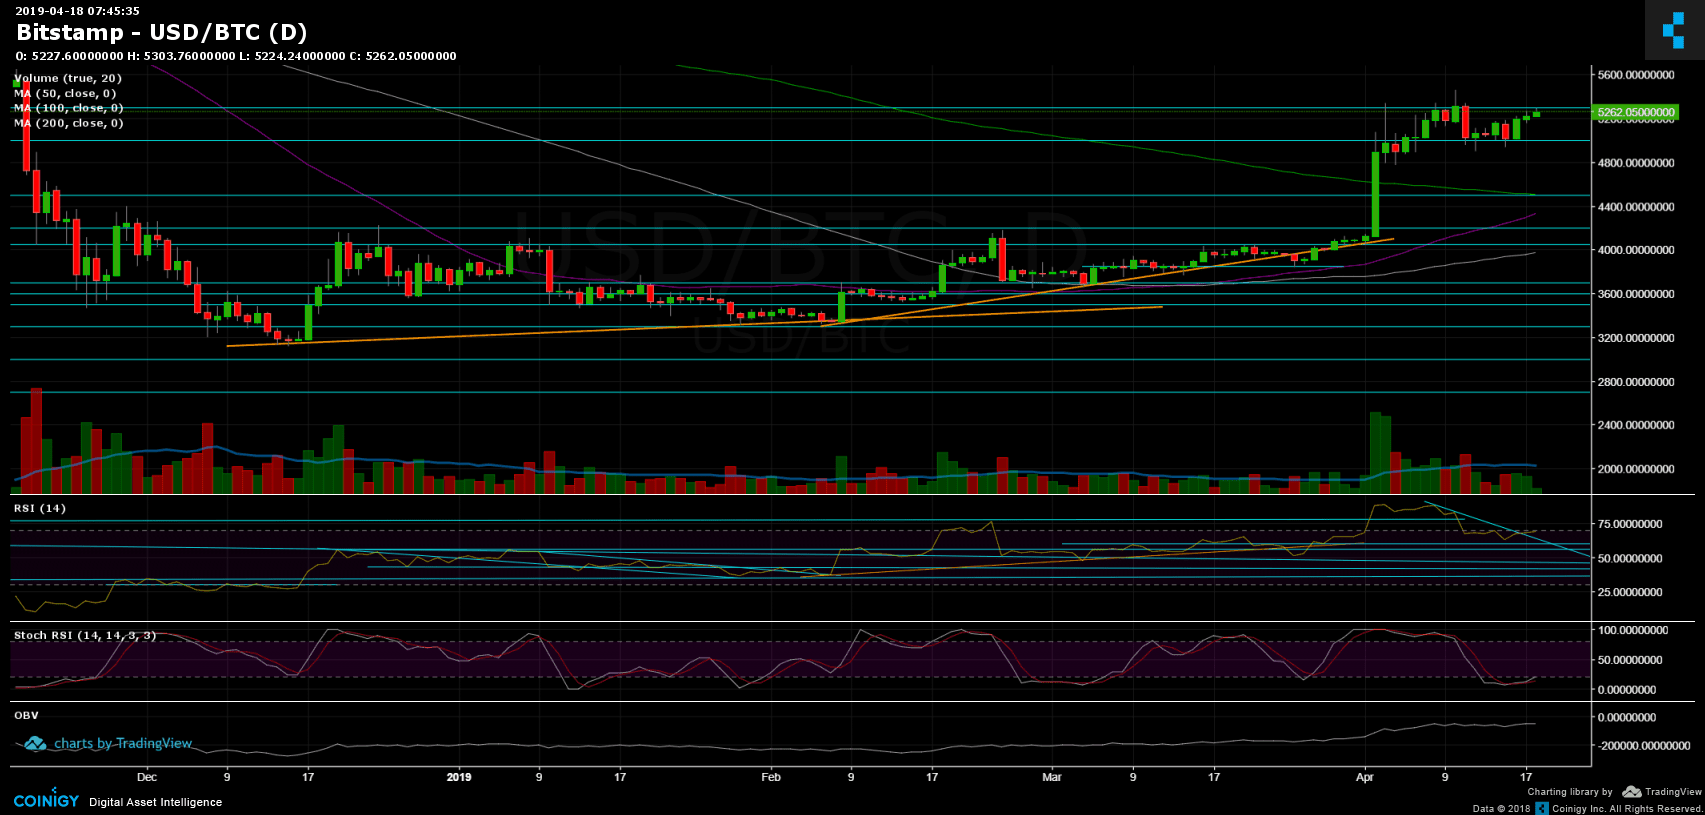
Looking at the daily chart, we can see the sideways movement over this time: from above there is the $5300 boundary, whereas from below is the $5000 boundary.
Since yesterday we can see Bitcoin making its way up, slowly toward the $5300 again, for the third time in the past 12 days. However, there are two options: The bullish one is, of course, breaking up (and holding it). The bearish scenario is completing a sort of head and shoulders pattern (now it is the right shoulder) with lower targets around $4500 – $4600.
Total Market Cap: $179.8 Billion
Bitcoin Market Cap: $93.4 Billion
BTC Dominance: 51.9%
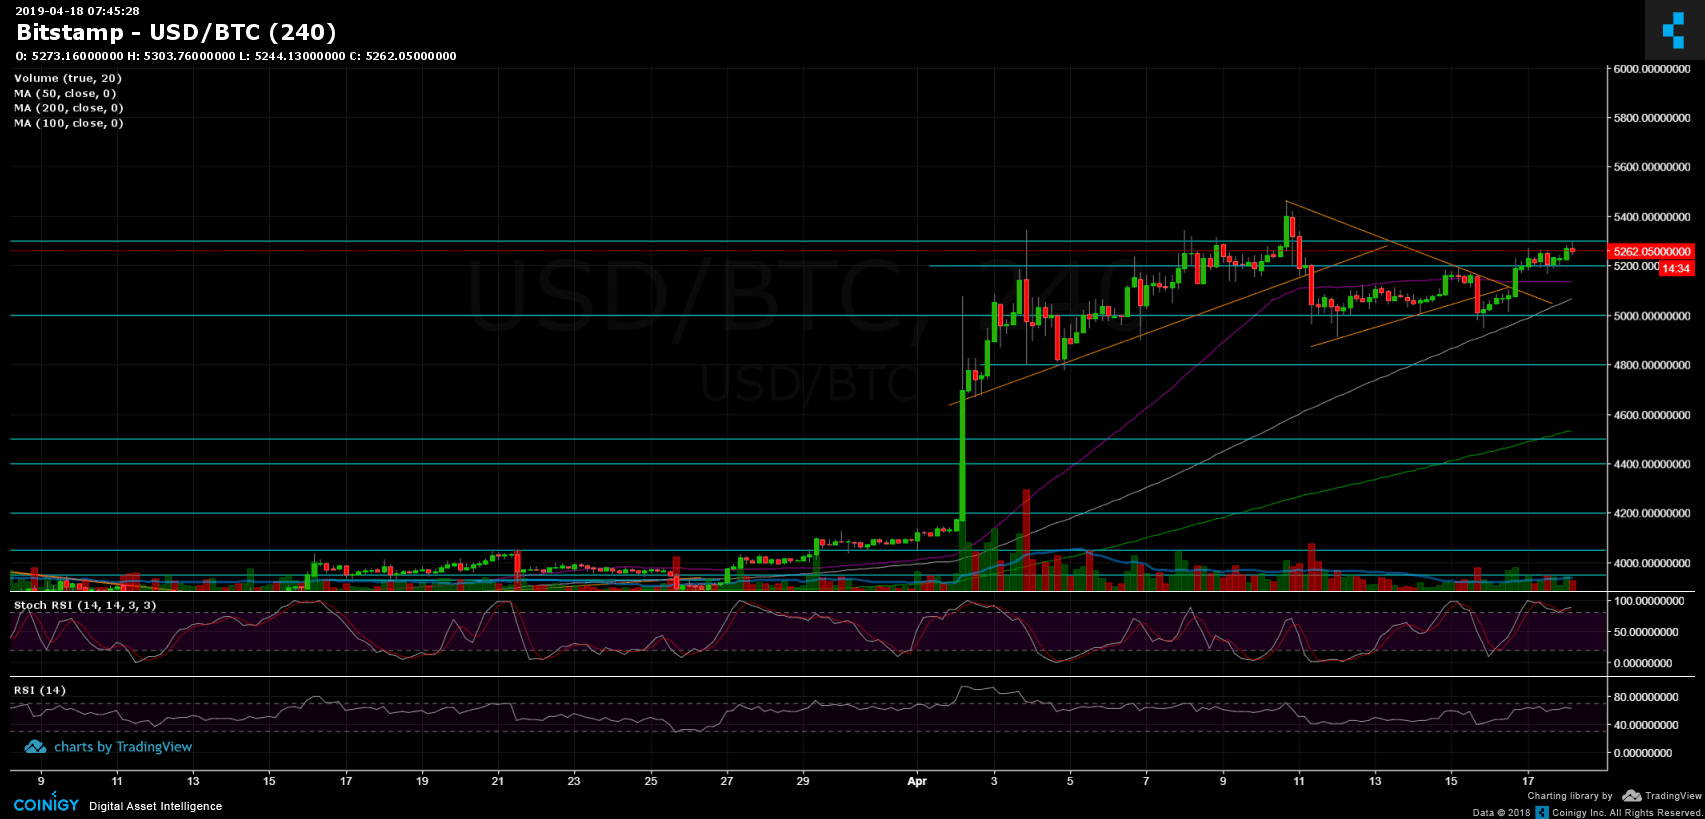
Looking at the 1-day & 4-hour charts
– Support/Resistance:
From below, the closest support level is the $5200, with some support coming from the 4-hour chart 50-days moving average line at $5150. Below lies the strong $5000 support level. Breaking down the last could target Bitcoin to retest prior support at $4800 and $4700. Further below is the 200-days moving average line (1-day chart) which is currently around $4500.
From above, the closest significant resistance is the $5300 – $5350 area. In the case of a break-up, the next target is the $5500 level before getting to the 2018 support turned resistance line at $5700.
– Daily chart’s RSI: Stochastic RSI oscillator of the daily chart had recently made a cross-over in the oversold area. This supports the option of a break-up of $5300. Besides, the RSI had broken up a descending trend-line, and now aiming at the 70 RSI level.
– The daily trading volume: In my opinion, the volume lacks, as the past few days carried low volume (and low volatility). In the case of a breakup, BTC will seek for higher amount of trading volume.
– BitFinex open short positions: the open short positions, had slightly increased to 19.5K BTC of open positions.
BTC/USD BitStamp 4-Hour Chart
BTC/USD BitStamp 1-Day Chart
The post Bitcoin Price Analysis April 18: BTC Is Facing $5300 For The Third Time – What’s Coming Up Next? appeared first on CryptoPotato.