Bitcoin Price Analysis April 13: Bitcoin Seems Steady Above $5000. But, What’s Next?
Since our recent analysis, and the following update which was written just hours after as the break down took place, Bitcoin seems steady on top the significant $5000 support area.
In our recent price analysis we warned from the 1-day Stochastic RSI oscillator’s cross down: “The Stochastic RSI oscillator had recently crossed over at the bullish territory and now pointing down. This might lead to a deeper correction.” It was written while Bitcoin’s price was $5300 – $5400.
How deep will this correction be? Everything is explained below. To sum it up, the next critical levels of support (for the big picture) lie at $5000, $4500 and $4200.
Total Market Cap: $171.8 Billion
Bitcoin Market Cap: $89.5 Billion
BTC Dominance: 52.1%
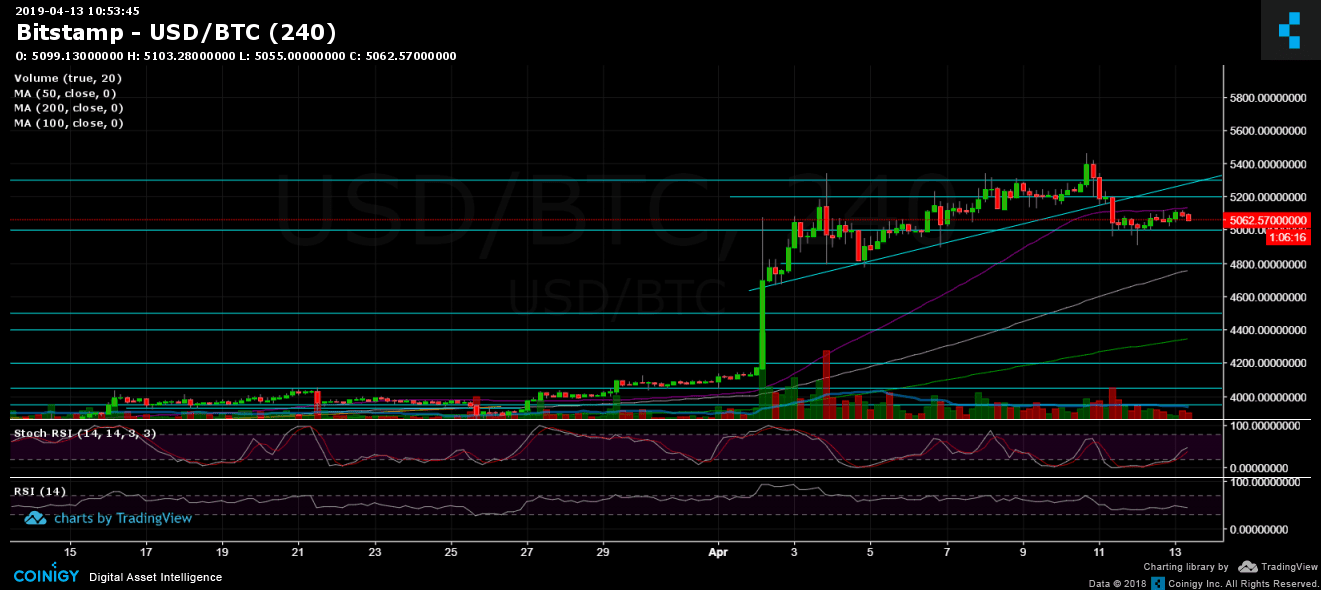
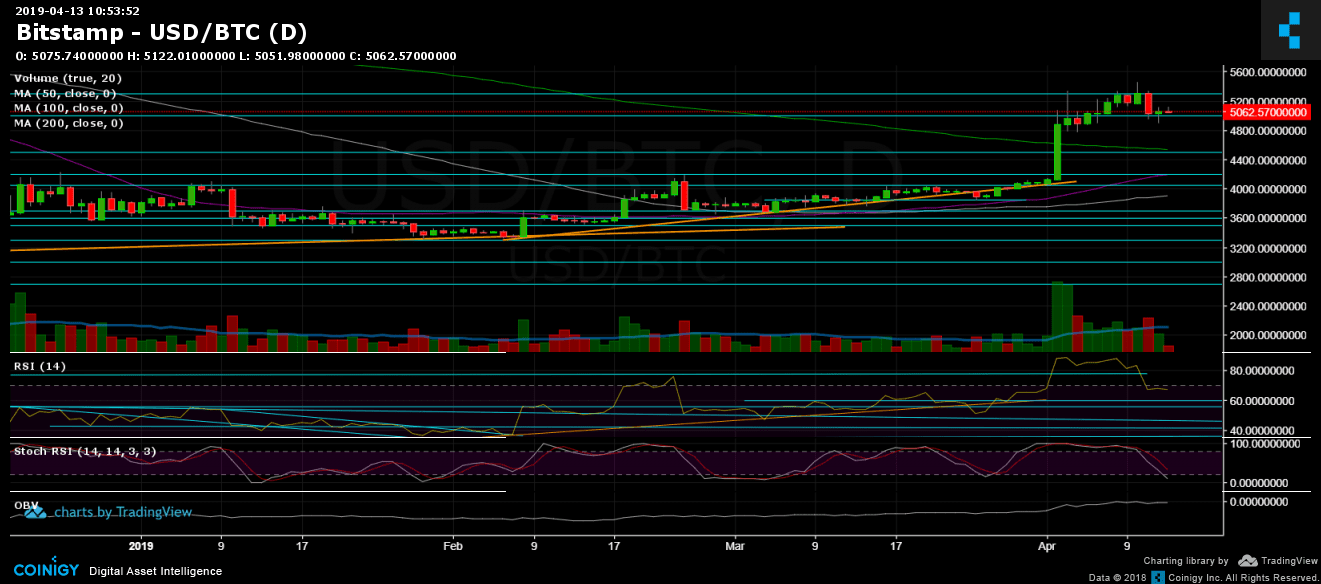
Looking at the 1-day & 4-hour charts
– Support/Resistance:
Following the breakdown of the ascending trend-line and the ascending triangle on the 4-hour chart, Bitcoin reached the next significant support area around the $5000 level. So far it looks like the mentioned support area holds up. In case of breaking down, further support is located at $4800. Below are the $4700 and the 200-days moving average line (1-day chart) which is currently around $4530. Looking at the bigger picture, as long as Bitcoin maintains the $4200 area, the chances that we have seen the bottom of the current bear market are very high.
From above, the nearby resistance lies at $5100. Further support turned resistance level lies at $5200, before reaching the $5300 – $5350 area. The next significant resistance lies at the past week’s high around $5500 before getting to the 2018 legendary support turned resistance line at $5700.
– Daily chart’s RSI: The RSI is pointing down, following the cross down of the daily Stochastic RSI oscillator. There is still a little room to move down here. However, the RSI is very close to the oversold territory.
– The daily trading volume: The trading volume of the past two days is meager. This could be because of the weekend, but a positive sign is that the volume of the buyers is higher than the volume of the sellers.
– BitFinex open short positions: Like Bitcoin’s price, the open short positions, are steady for two days around 18.8K BTC of open positions.
BTC/USD BitStamp 4-Hour Chart
BTC/USD BitStamp 1-Day Chart
The post Bitcoin Price Analysis April 13: Bitcoin Seems Steady Above $5000. But, What’s Next? appeared first on CryptoPotato.