Bitcoin Price Analysis: Another Whale Trap Or BTC’s Dump To $10K Very Soon?
Bitcoin’s price is back in decline as $12 billion suddenly evaporated off the crypto market cap. This includes approximately $10 million worth of BitMEX BTC longs, which have already been liquidated due to the sudden breakdown.
In the last 4 hours, BTC has tanked over 3% from $10,900 to a low of $10,560 and broken through both the 50 and 200-day EMA lines. The rest of the altcoin market is also experiencing heavy losses as traders withdraw into Stablecoins and other safer assets.
This is now the fourth significant flash crash to have taken place on the 4-hour BTC/USD chart since the start of September.
In our most recent BTC price analysis, we had spotted this weakness, despite that Bitcoin was still around the $11,000 price area.
Not surprisingly, this comes as the global equity markets further crash, while Wall Street futures tank 2% as of writing these lines.
Price Levels to Watch in the Short-term
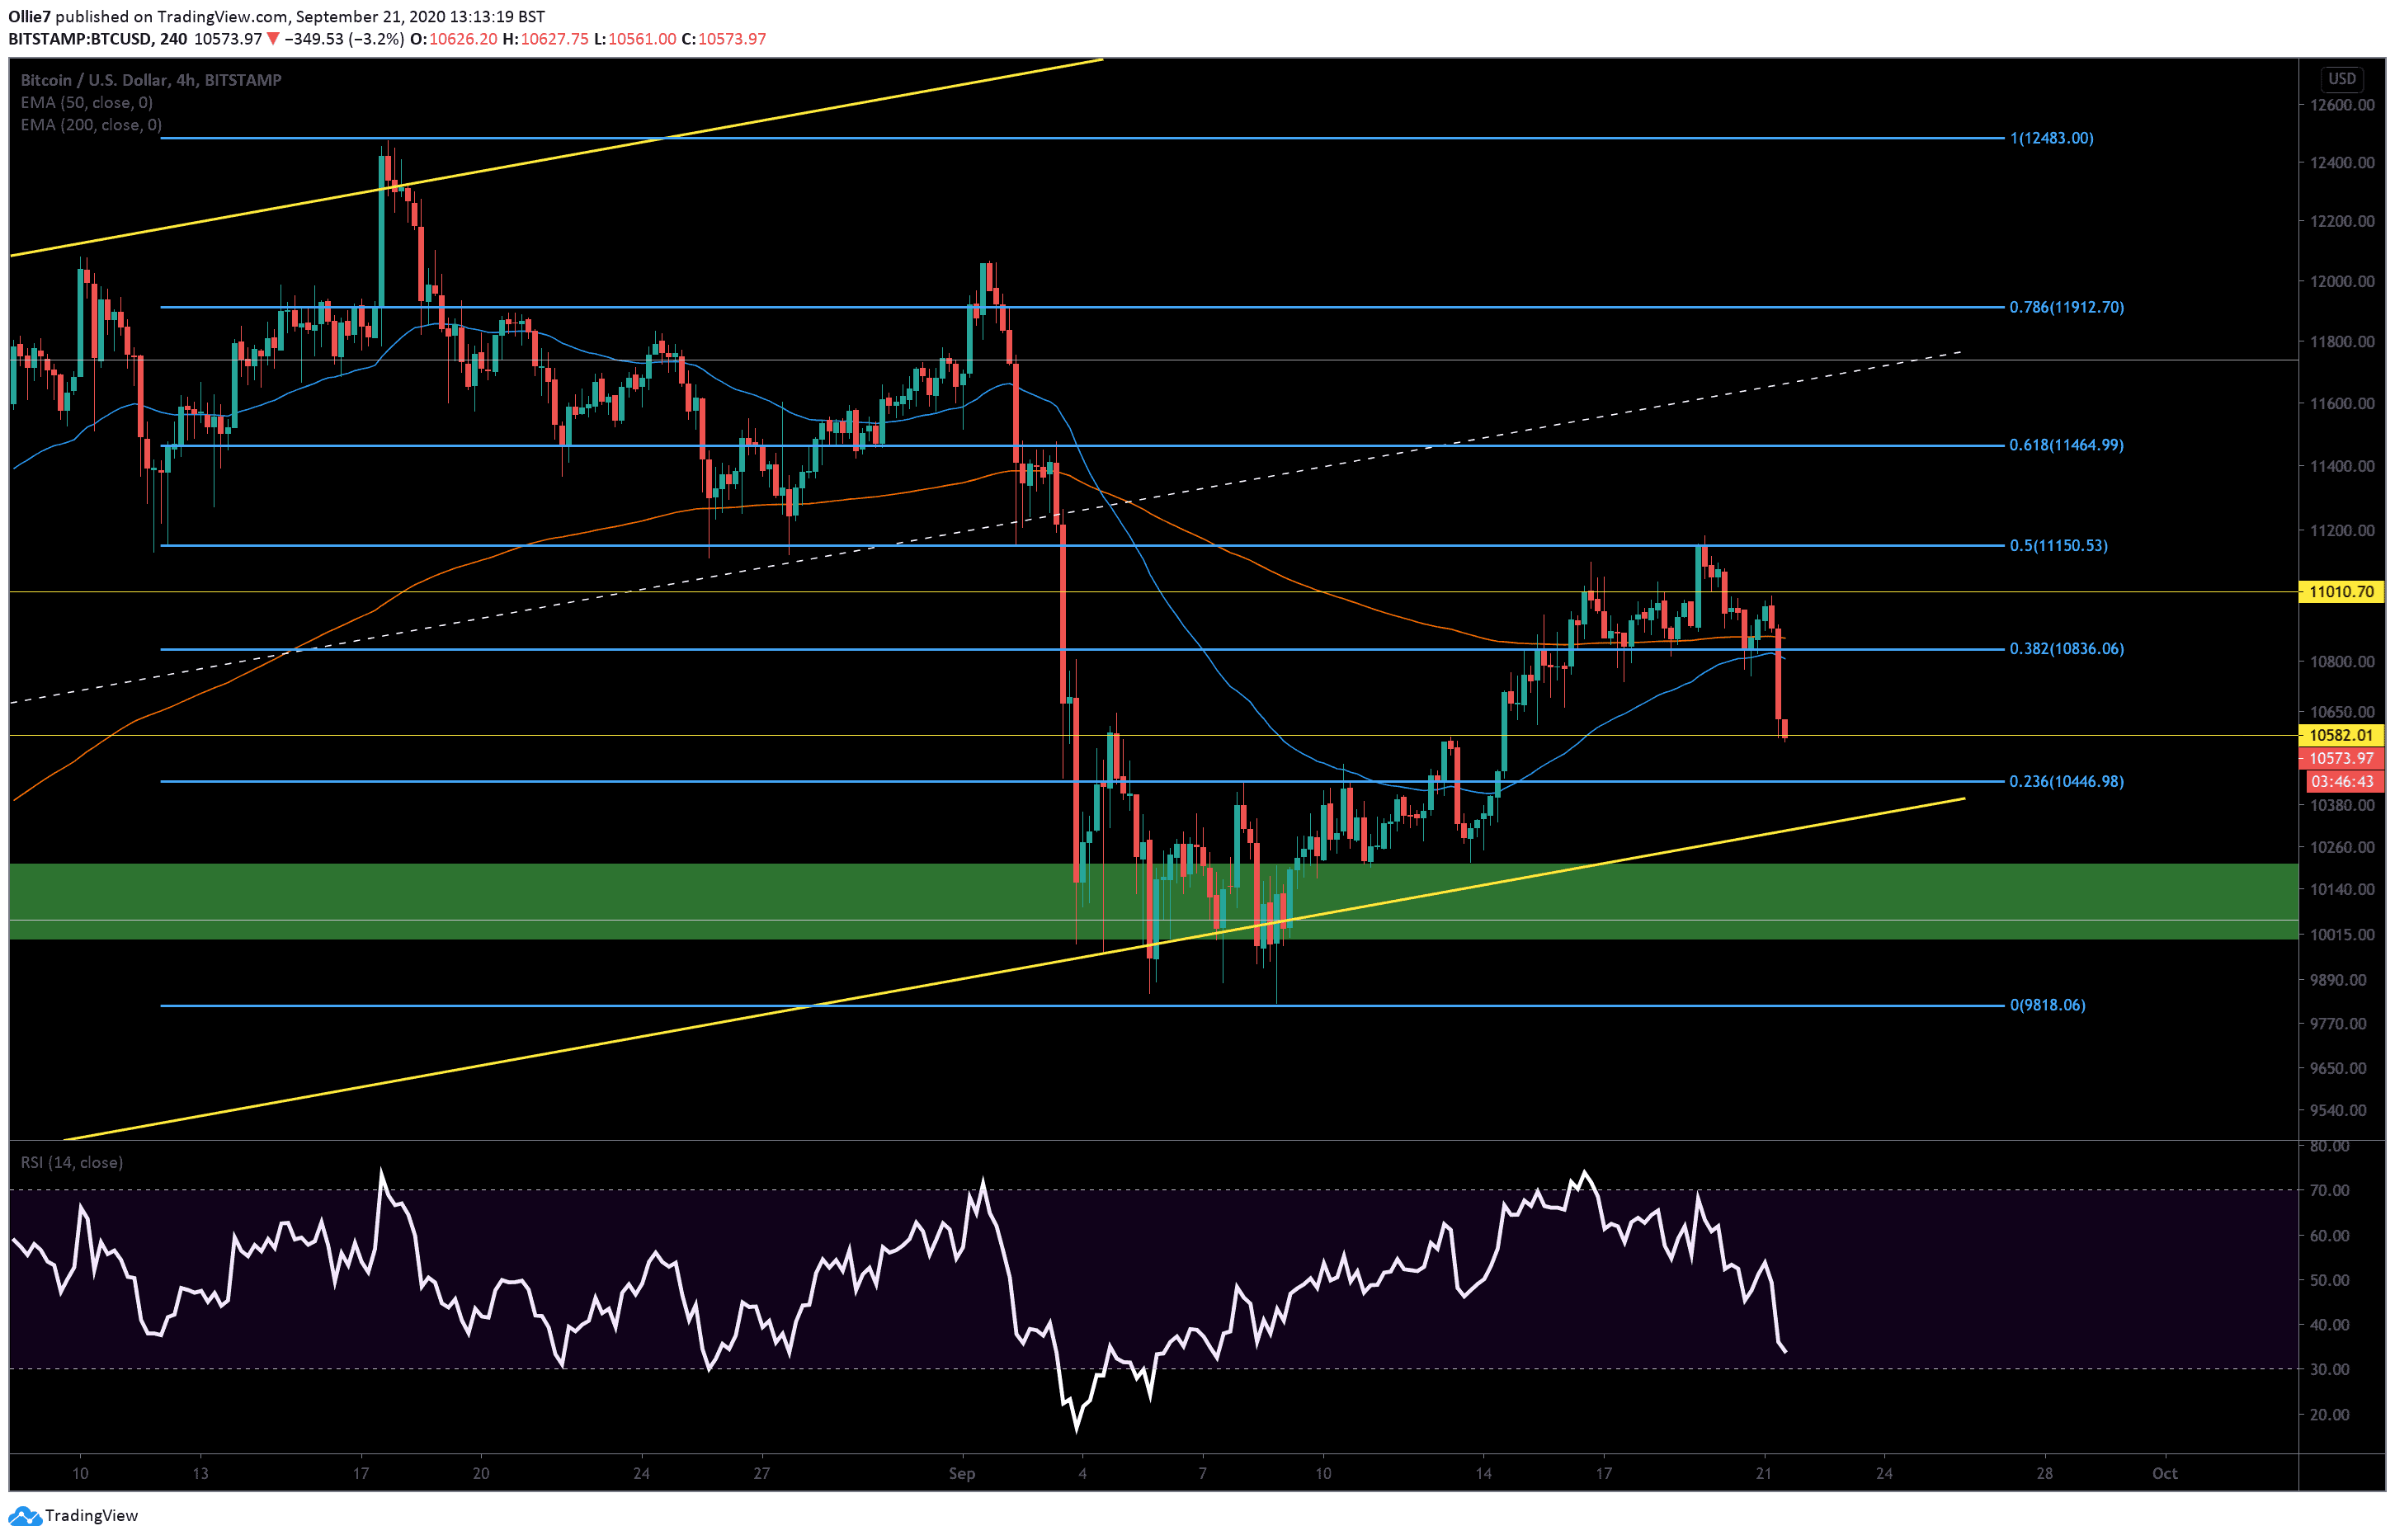
A minor correction was to be expected after Bitcoin cleanly ricocheted off the 0.5 Fibonacci level at $11,150 on September 19. However, after finding support and recovering of the 0.382 Fibonacci level, not many traders were expecting a crash through the strong support and both EMA lines.
Right now, BTC appears to be heading towards the 0.236 Fibonacci support at $10,446 after selling pressure overcame the $10,580 level with little resistance.
If the bearish momentum continues through the 0.236 Fibonacci level, then we should expect to see bullish traders push back at the main channel support (yellow line) if it reaches that far. This would like to be around the $10,320 area.
There may be some hope, however, as the current price action resembles a whale manipulation pattern that took place a short while ago between September 13-14 (marked by the white box).
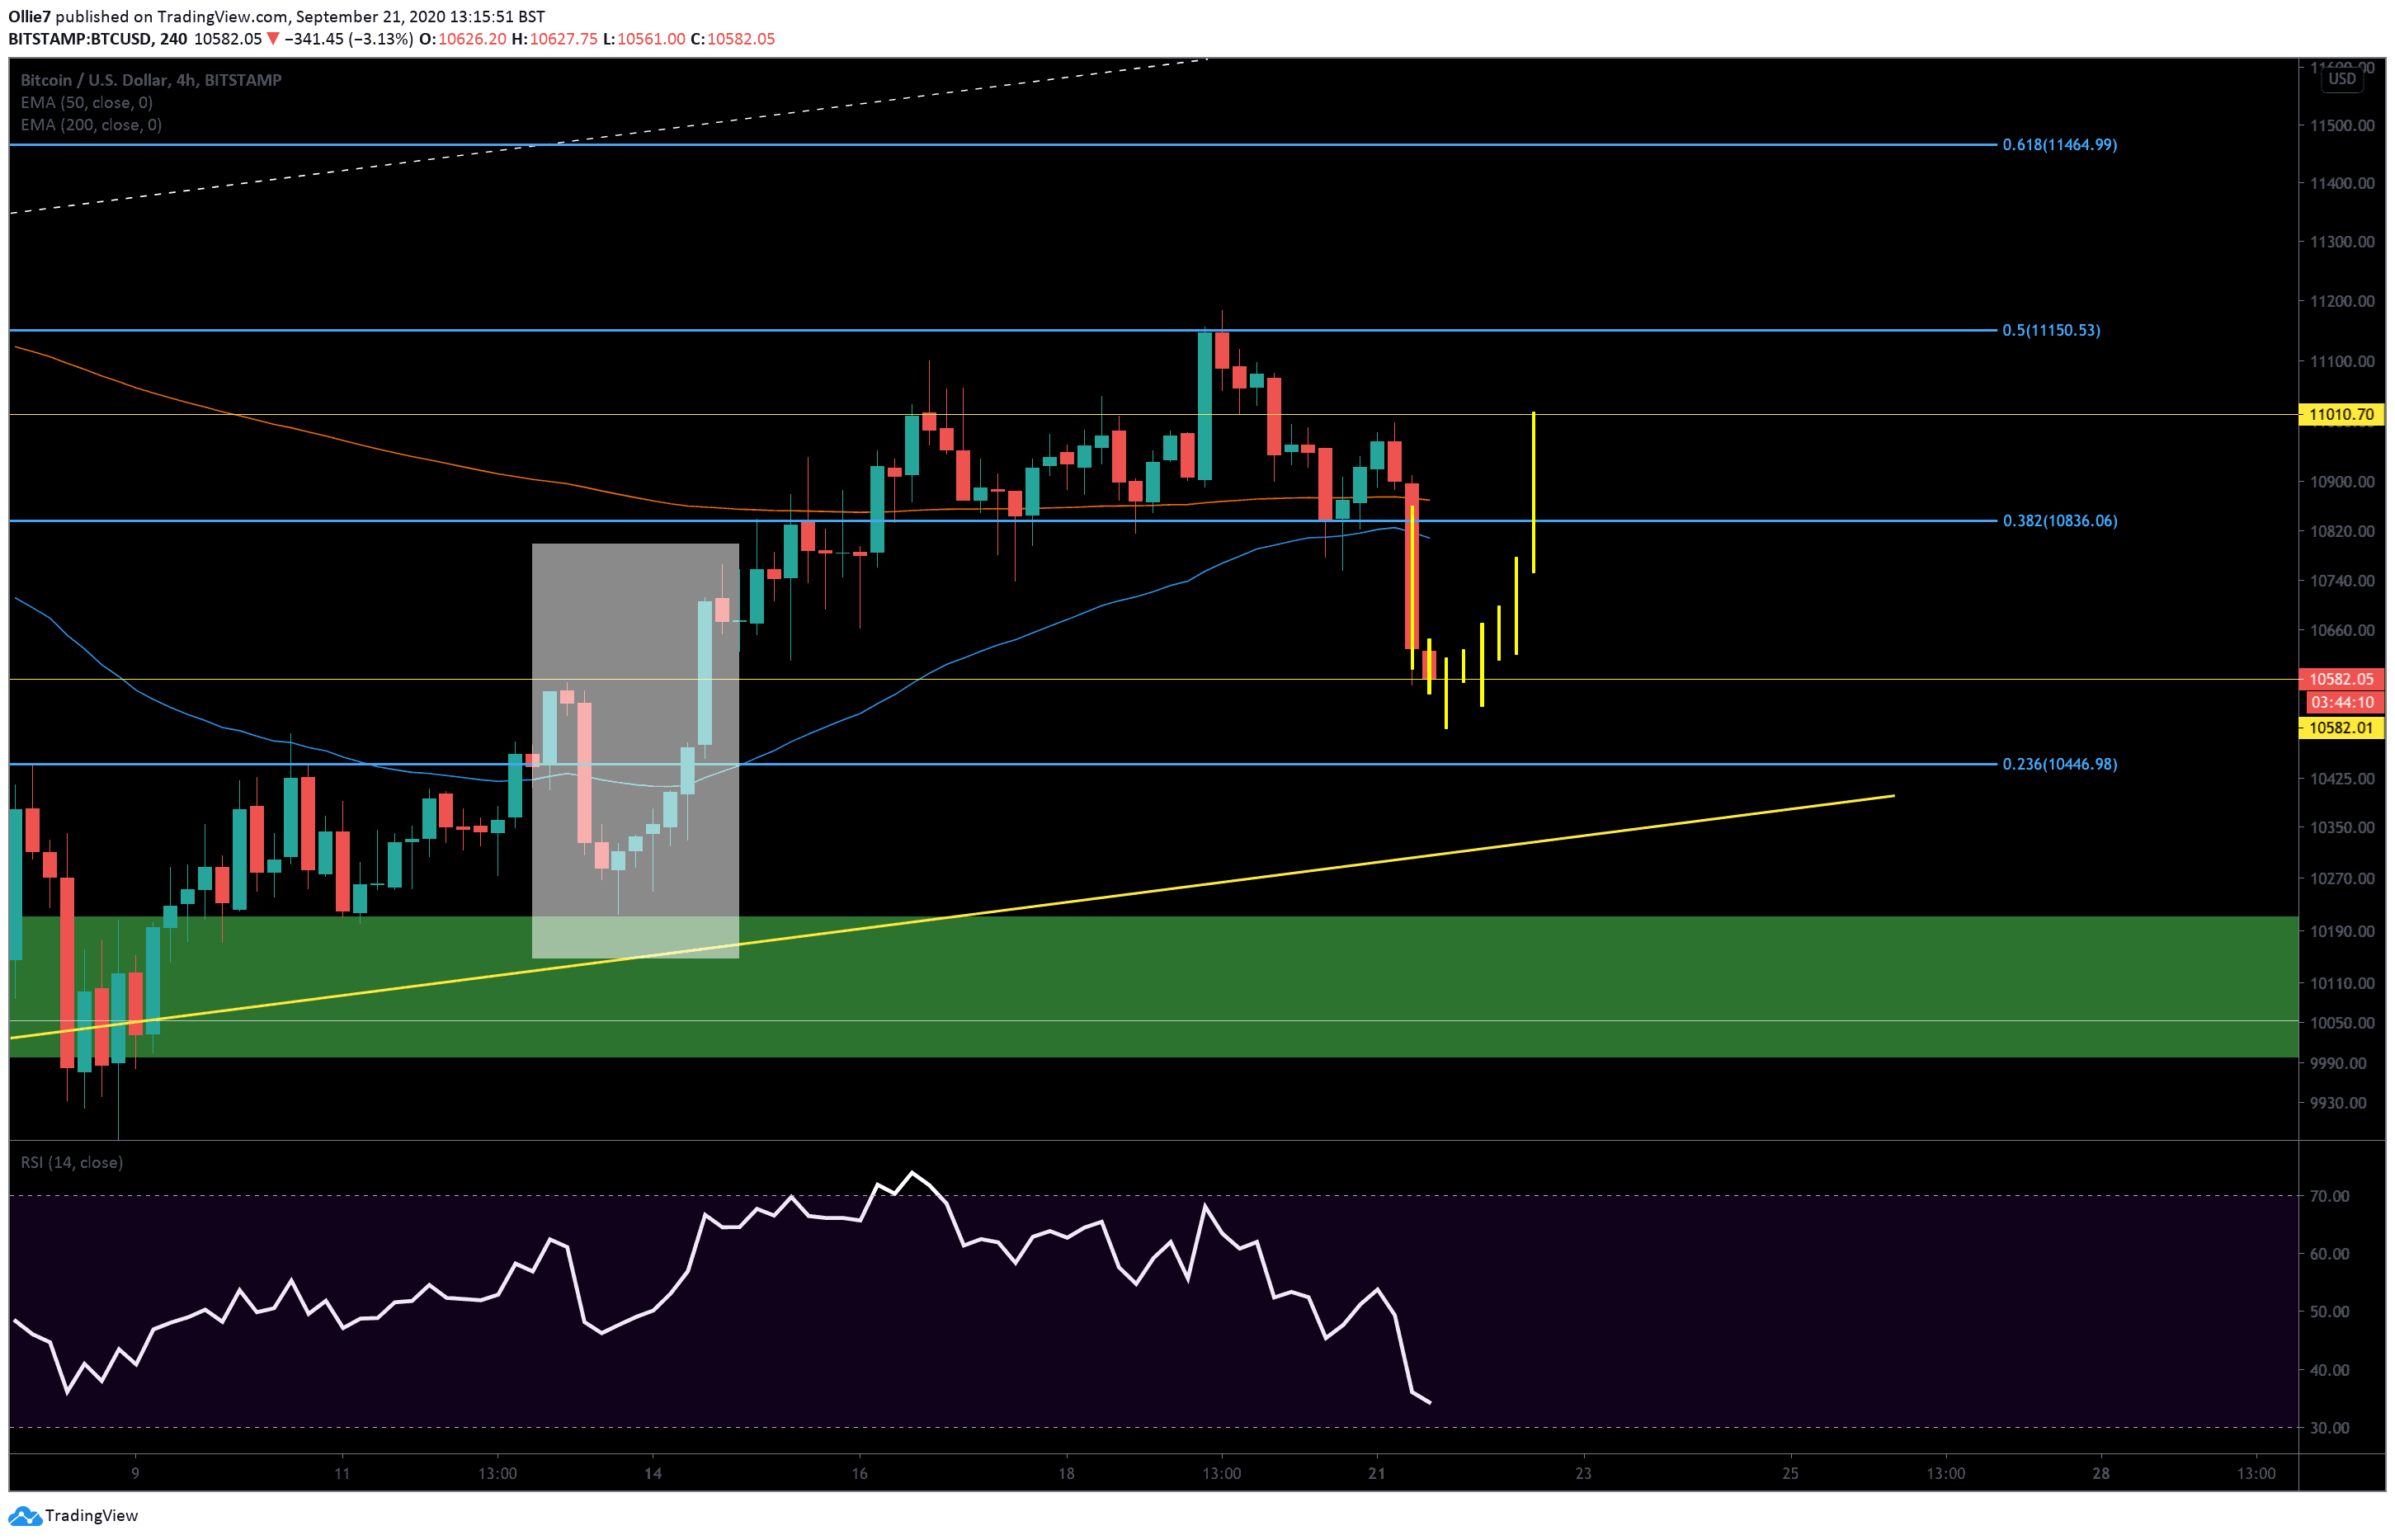
As we can see, BTC prices tanked after touching a key resistance, followed by a brief period of consolidation along with a lower support before arching back to print a new higher high. By pasting this movement over the current candle action (yellow projection lines), it shows we could see a brief consolidation at the flipped $10,580 support followed by a surge back towards $11,000 – if this does turn out to be the same manipulation pattern.
Total market capital: $339 billion
Bitcoin market capital: $196 billion
Bitcoin dominance: 57.9%
*Data by Coingecko.
Bitstamp BTC/USD 4-Hour Chart
The post Bitcoin Price Analysis: Another Whale Trap Or BTC’s Dump To $10K Very Soon? appeared first on CryptoPotato.