Bitcoin Price Analysis: Another Retest Of The Long-Term Support Line, Do or Die For BTC
And the Bitcoin extreme volatility continues: After the $2,000 24-hour drop two days ago, Bitcoin found support on top of the ascending trend-line (daily chart).
The correction was respectable: Bitcoin almost touched the $12,000 resistance, but then got rejected, plunging down to where it’s currently trading at, $11,300 at the time of writing. Not surprisingly, this is accurate to another retest of the ascending trend-line.
From here, a breakdown and lower support areas are next to be tested. However, it’s still not considered a change of momentum (from bullish to bearish, in my opinion) as long as the $9,400 – $9,600 is kept up. So there won’t be a lower low pattern, which is bearish.
What is impressive is that despite the plunging Bitcoin, the BTC dominance stays as is. The situation for the altcoins couldn’t be worse. Ethereum is at legendary support zones against Bitcoin back from December 2017. Ripple is a complete crash since 2019 begun (against Bitcoin).
Total Market Cap: $309 billion
Bitcoin Market Cap: $201.5 billion (still on top the $200 Billion price mark)
BTC Dominance Index: 65.1%
*Data by CoinGecko
Key Levels to Watch
– Support/Resistance:
Bitcoin is now facing the long-term ascending trend-line (on the daily chart, marked in orange). This line was started forming since the middle of May of this year. Below, the next level of support lies at $11,000. Further down is $10,800, $10,500 (along with the MA-200 of the 4-hour chart, marked in green) and $10,000. Below $10K, two critical levels to watch for: $9,800 along with the 50-days moving average (marked in purple), $9,600, which is the low since the parabolic move had begun, and $9,400 – a significant support level of the previous double top from June.
From above, there are the support turned resistance levels at the $11,500 – $11,600 area, $12,000 and $12,500. Above the last is the high that was reached yesterday at $13,000 – $13,200.
– Daily chart’s RSI: The RSI is facing the 50 area, which can also indicate the change from bullish to bearish conditions (RSI under 50). The RSI hadn’t been in such low levels since June 11 and about to create a first lower low (bearish) since then.
– Trading Volume: We are now during the weekend. There is a high chance to manipulate the market; however, the volume is relatively low, as of now.
– BitFinex open short positions: After recording their yearly low below 5K BTC short positions, the number had increased a bit to 6.5 BTC of short positions. However, we can’t ignore the manipulations during the past week of a sudden 65% drop in the shorts number.
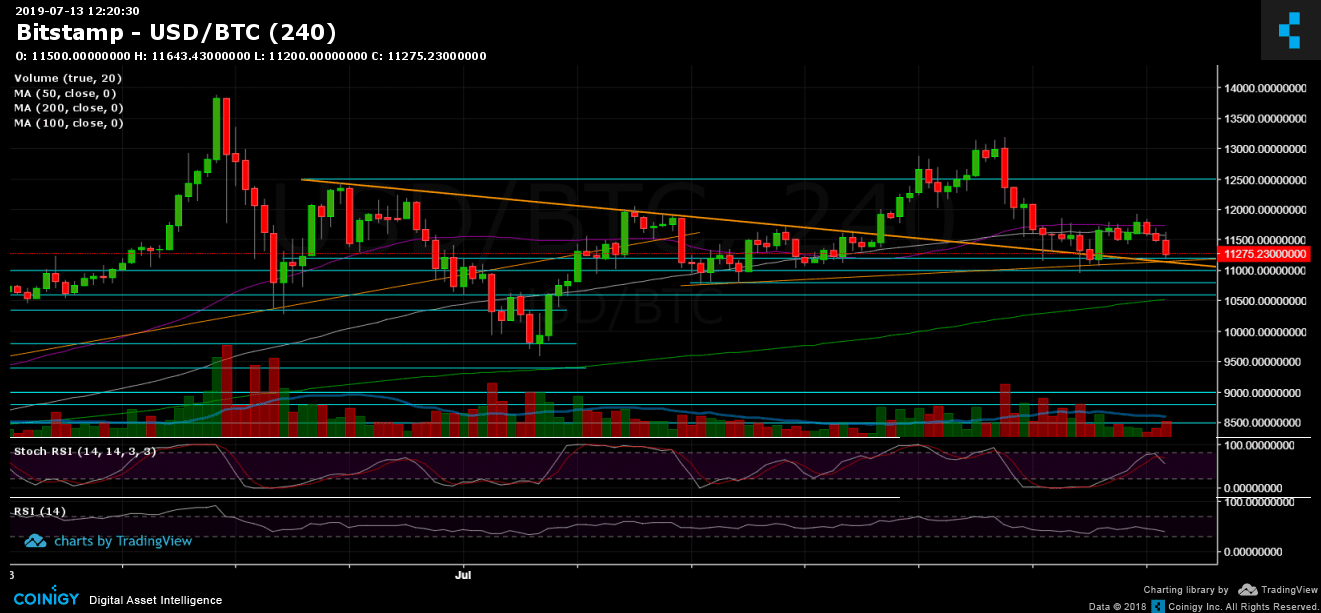
BTC/USD BitStamp 4-Hour Chart
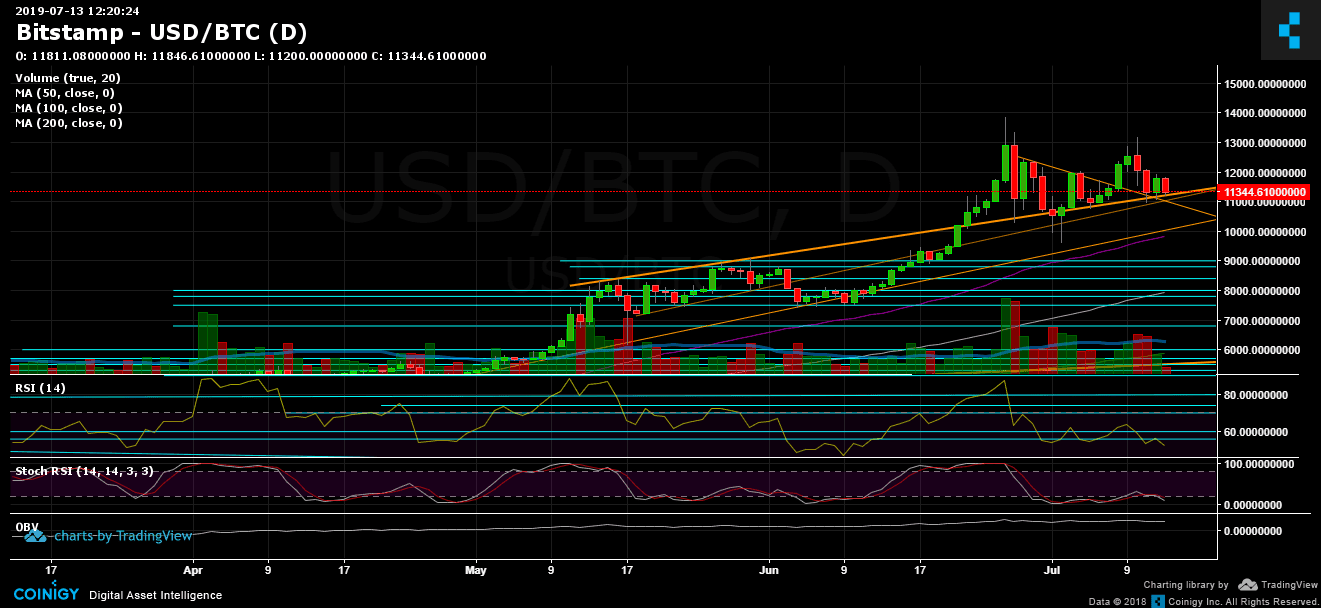
BTC/USD BitStamp 1-Day Chart
The post Bitcoin Price Analysis: Another Retest Of The Long-Term Support Line, Do or Die For BTC appeared first on CryptoPotato.