Bitcoin Price Analysis: After Touching a 12-Day High, Can BTC Retest $40K Soon?
Following another red weekend, just like the previous ones in June, since Monday, bitcoin increased by a total of 8% as the coin reclaimed the $35K price area, as of writing these lines.
The recent price hike has brought some optimism back into the market, especially after bitcoin sustained the double-bottom bullish formation on the 4-hour chart (at $31.5K). However, the bigger picture hasn’t changed as Bitcoin still trades inside the trading range of $30K – $42K.
BTC also managed to break a long-term descending trendline that dates back to the May highs during the move higher. Yesterday, it found resistance at the 20-day MA amid $36K, which was the highest level it reached since June 18. However, bitcoin couldn’t hold it and dropped towards $35k over the past hours.
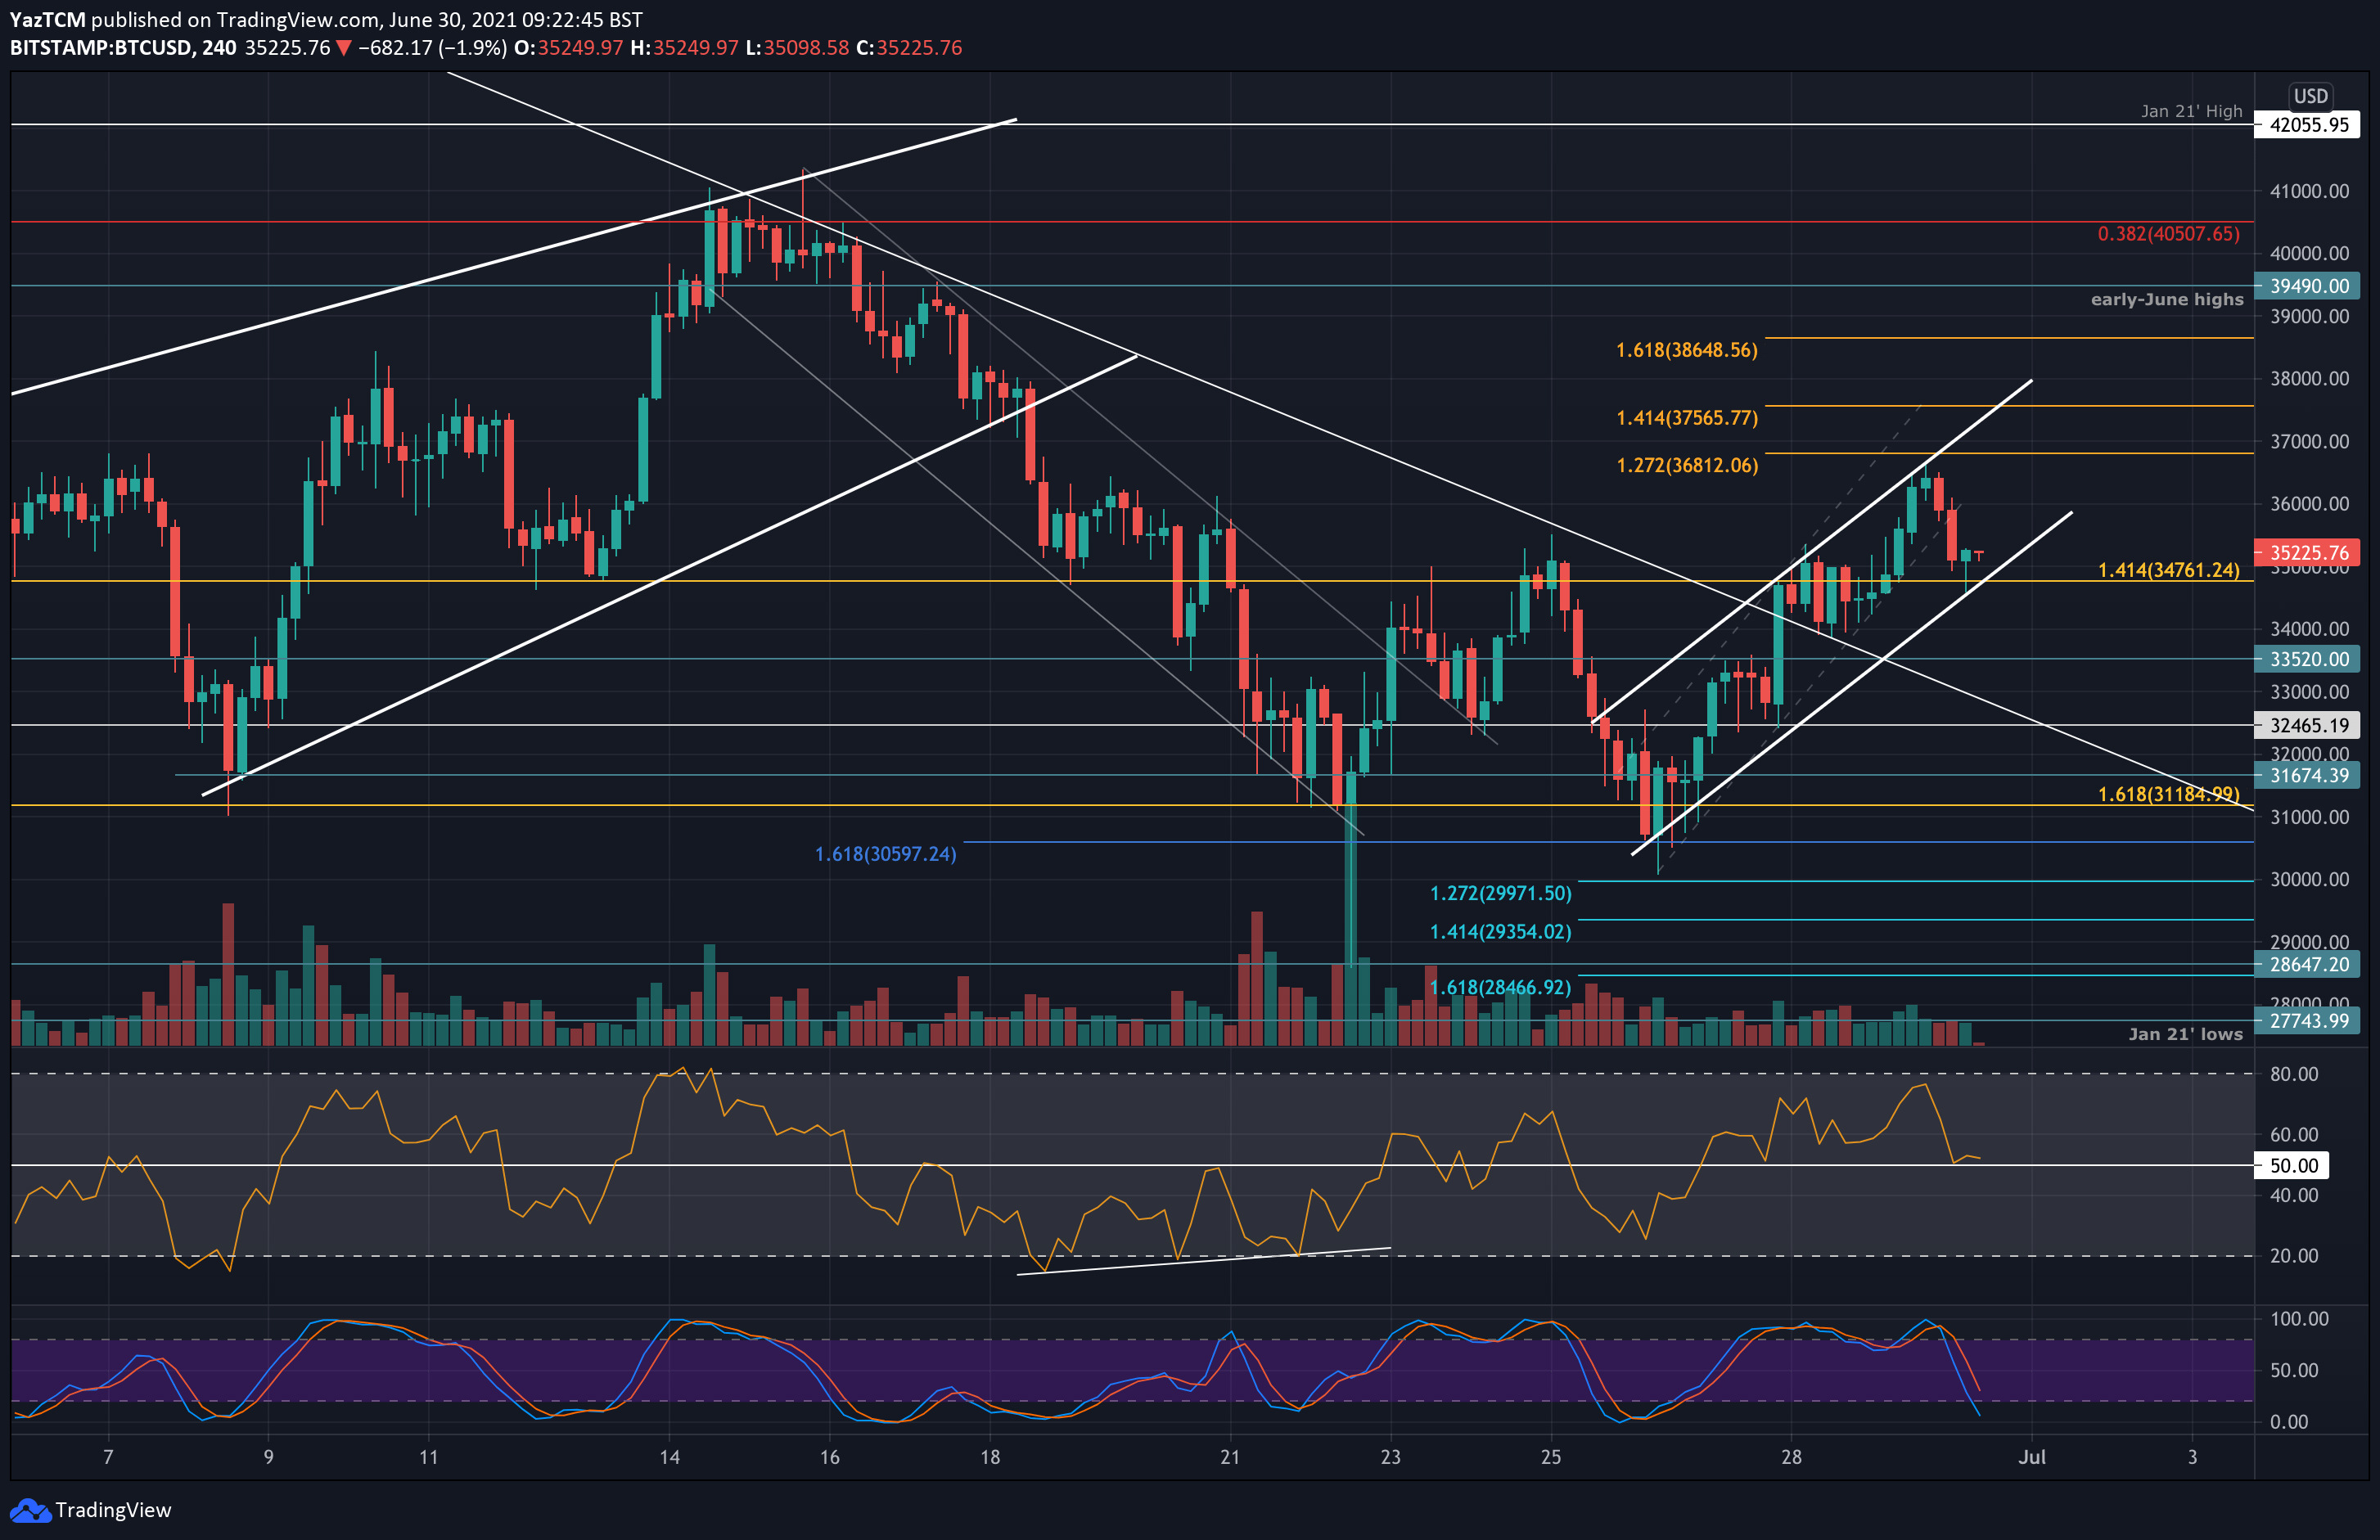
As shown on the following short-term charts, bitcoin continues trading inside an ascending price channel, after it found support around $34,600 earlier today. It is currently battling to remain above $35,000 and, if this level holds, we could expect it to head toward the upper angle next at around the $37-38k range.
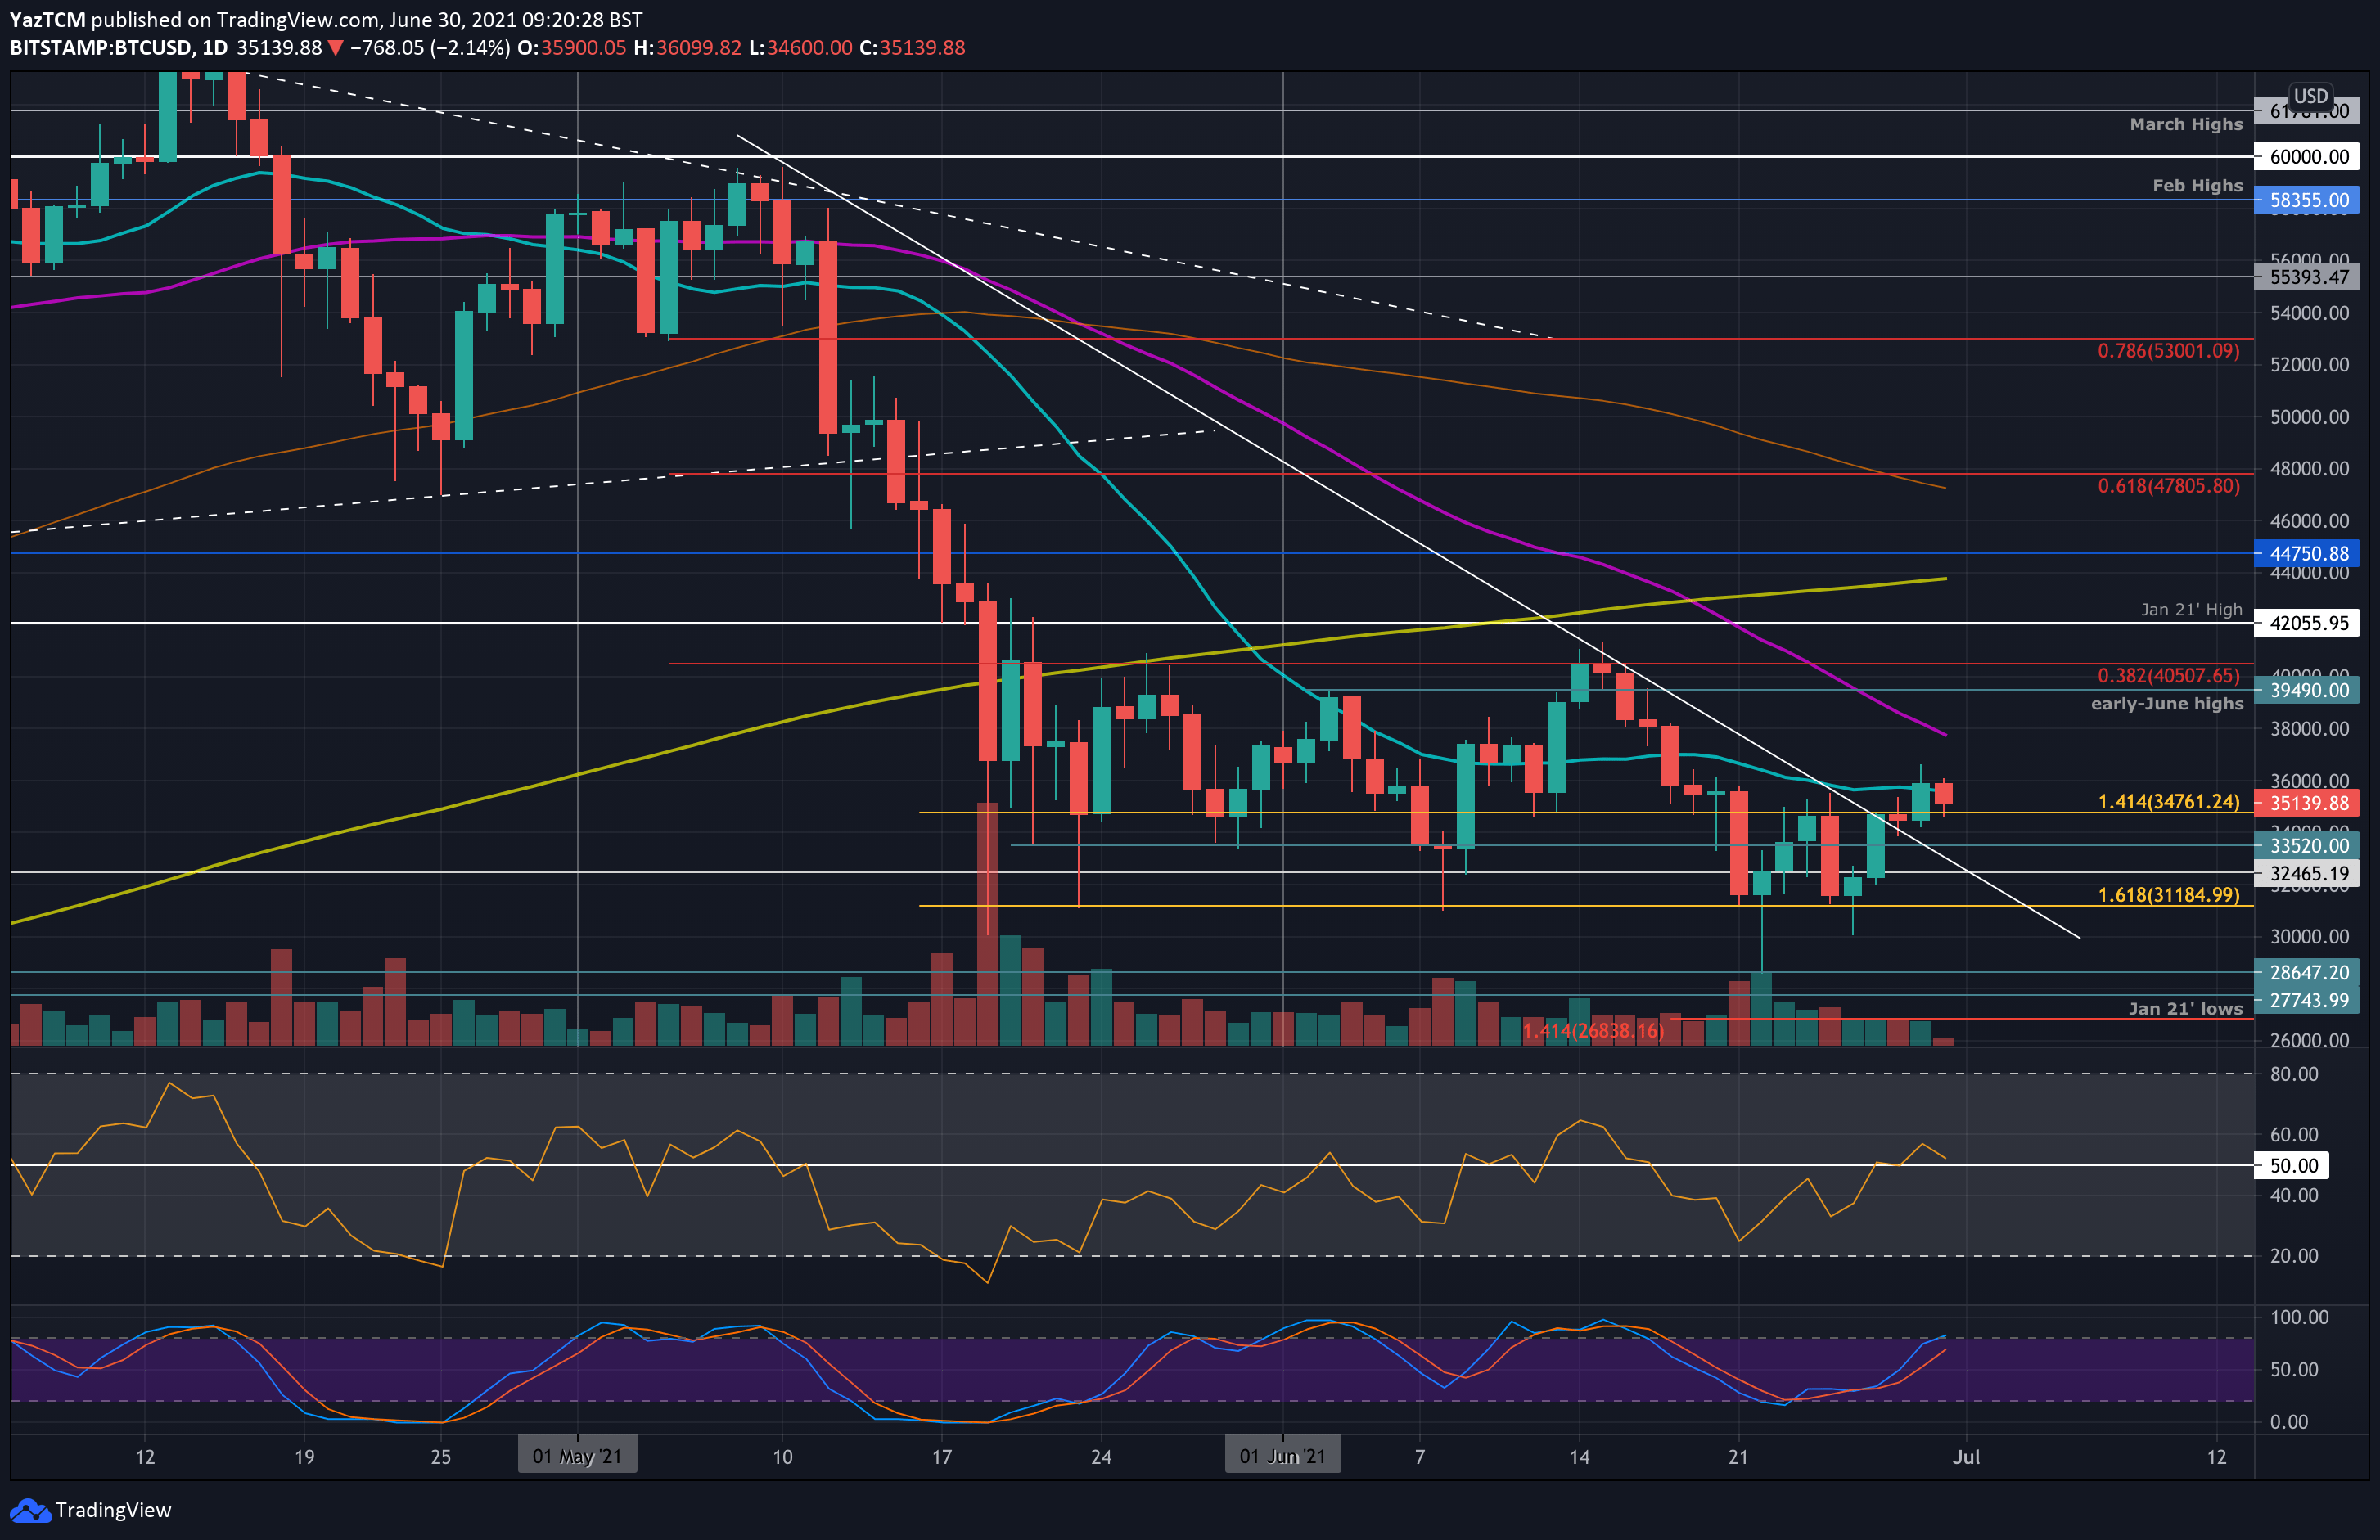
Before we can continue the optimism in the market, it would be critical for BTC to produce a daily close above the 20-day MA, which currently lies at $35.6K, after spending almost twelve days beneath the significant moving average line. Also – the daily RSI is showing some worrying signs for the bulls (more info below).
BTC Price Support and Resistance Levels to Watch
Key Support Levels: $35,000, $34,000, $33,520, $32,460, $31,185.
Key Resistance Levels: $35,620, $36,810, $37,800, $38,650, $39,500.
Looking ahead, the first resistance lies betwee $35,600 (20-day MA). This is followed by $36,810 (1.272 Fib Extension, and yesterday’s high), $37,800 (50-day MA), $38,650 (1.618 Fib Extension), and $39,500 (early-June Highs).
On the other side, the first resistance turned support lies at $34,600 (lower angle of price channel and today’s low). This is followed by $33,520, $32,460, $31,185 (downside 1.618 Fib Extension), and $30,600.
The daily RSI recently poked above the midline with the push toward the 20-day MA. It has since fallen as it returns to the midline again, indicating indecision within the market. However, on the daily, we can clearly see the RSI forming lower-highs, a trajectory that started forming in mid-February. in order to turn mid-term bullish, BTC has to break this bearish pattern.
Bitstamp BTC/USD Daily Chart
Bitstamp BTC/USD 4-Hour Chart