Bitcoin Price Analysis: After Correcting, BTC Faces the Critical 200-MA Again
The bearish divergence appearing on the BTC 4-hour chart for the past week managed to form a local top at $46.7k. BTC fell to a near-term low at $43.8k, finding support just above a key downtrend.
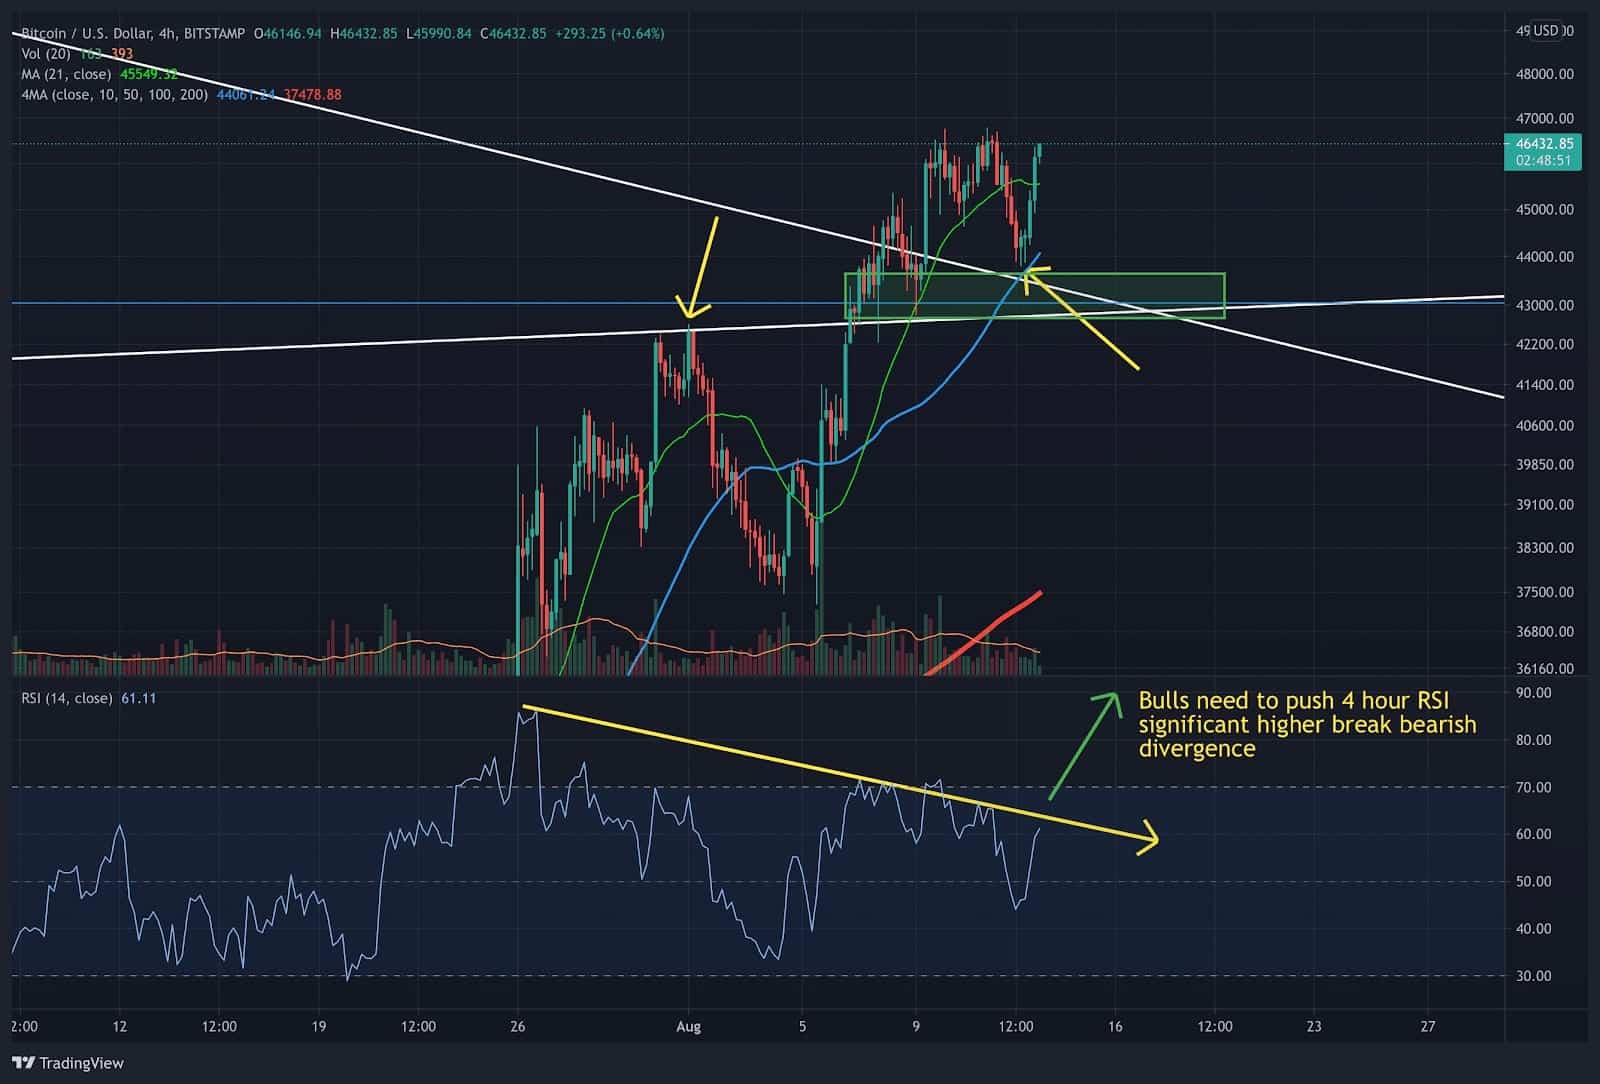
As we reported earlier, the recent dip below the 200-day moving average puts BTC in a tight spot as it is important to see a strong weekly close above that level. Making a weekly close above it, alongside the 21-week moving average, will flash a very bullish technical buy signal of the re-entry into bull market continuation. So far, it’s good to see BTC find support at the downtrend line, with a push back above the 200-day moving average.
What Happened During the Pullback?
The near-term pullback had less aggregate spot volume, signaling weak selling pressure. Most importantly, on-chain data by CryptoQuant showed consistent spot exchange outflows, no major build-up in exchange reserves, no major signal of large entities selling, with miner reserves continuing to increase. This strongly suggests that the weak hands got flushed out, as shown by the long liquidations on derivative platforms.
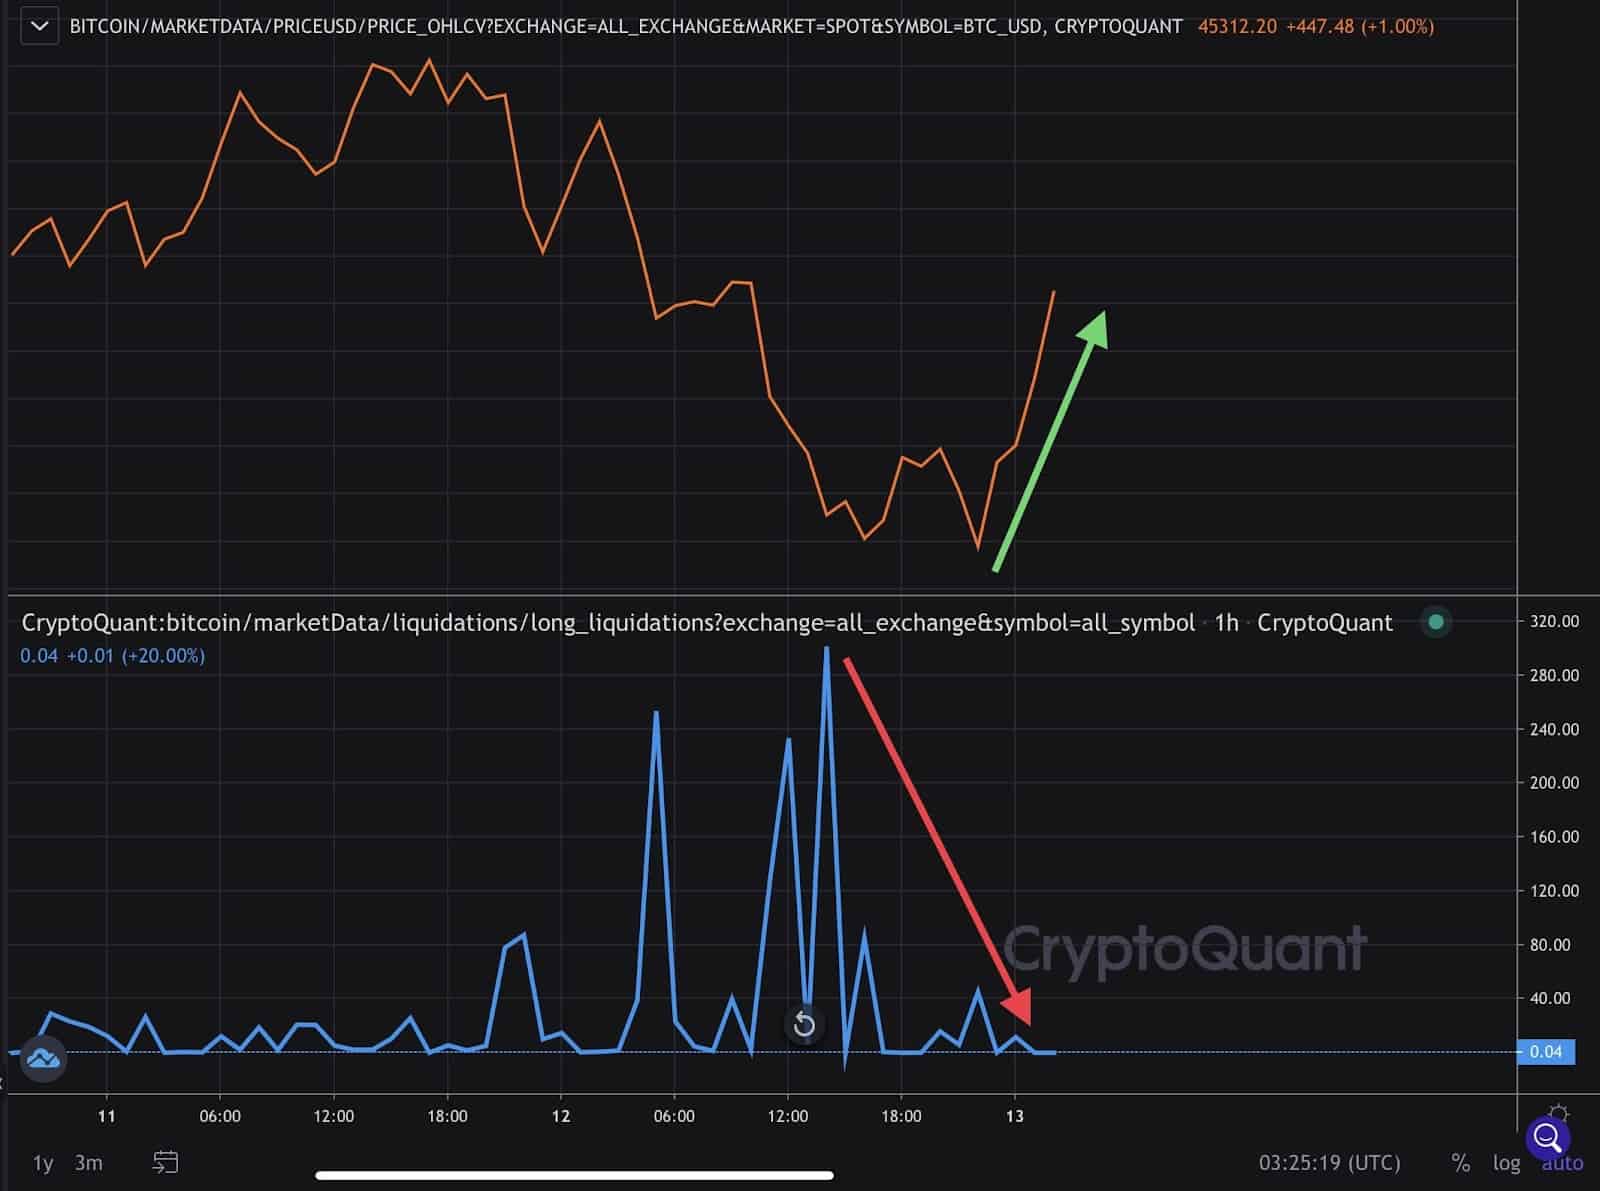
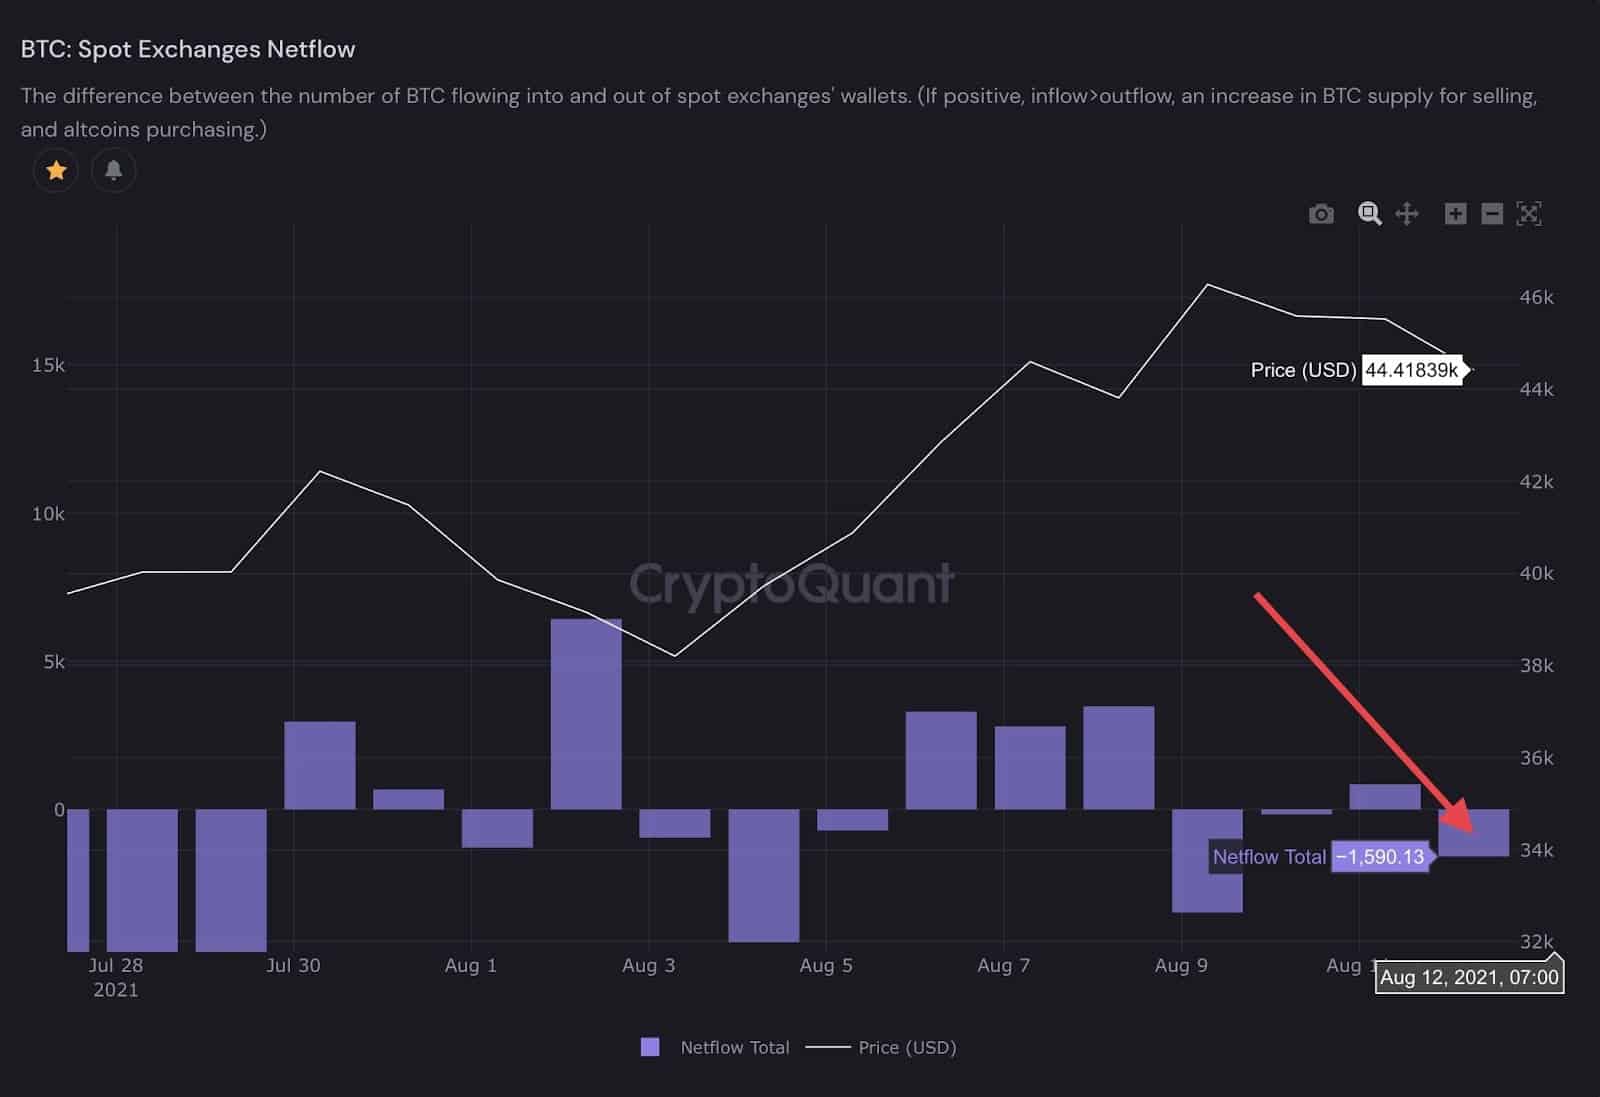
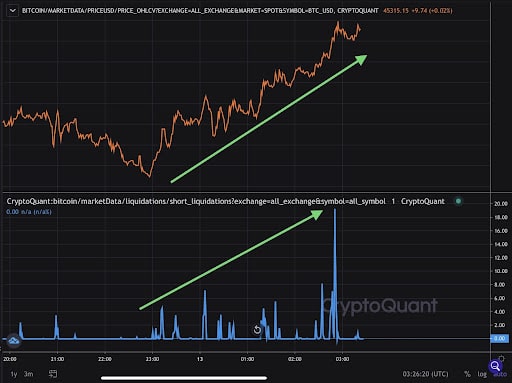
Long liquidations increased as BTC fell but eventually cooled off as short positions began piling on. Earlier today, BTC started pushing higher, and shorts began to get liquidated by the hour.
BTC Price Holds Support, What to Expect Next
For the near term, BTC is attempting to retest the local highs at $46.7k – a key level to close above. The 4-hour chart is still showing bearish divergence for the past week, but the relative strength index is slowly approaching the downtrend line as the near-term correction appears to be concluding.
Ideally, the bulls need to see a push above the local high at $46.7k to accelerate momentum to drive BTC towards the next major zone between $47k to $50k. On-chain analysis shows a moderate amount of realized price distribution in this range. The charts also show trading volume occurring between $47k to $50k. This suggests that a bit of supply could enter the market as investors in this range could be looking to break even.
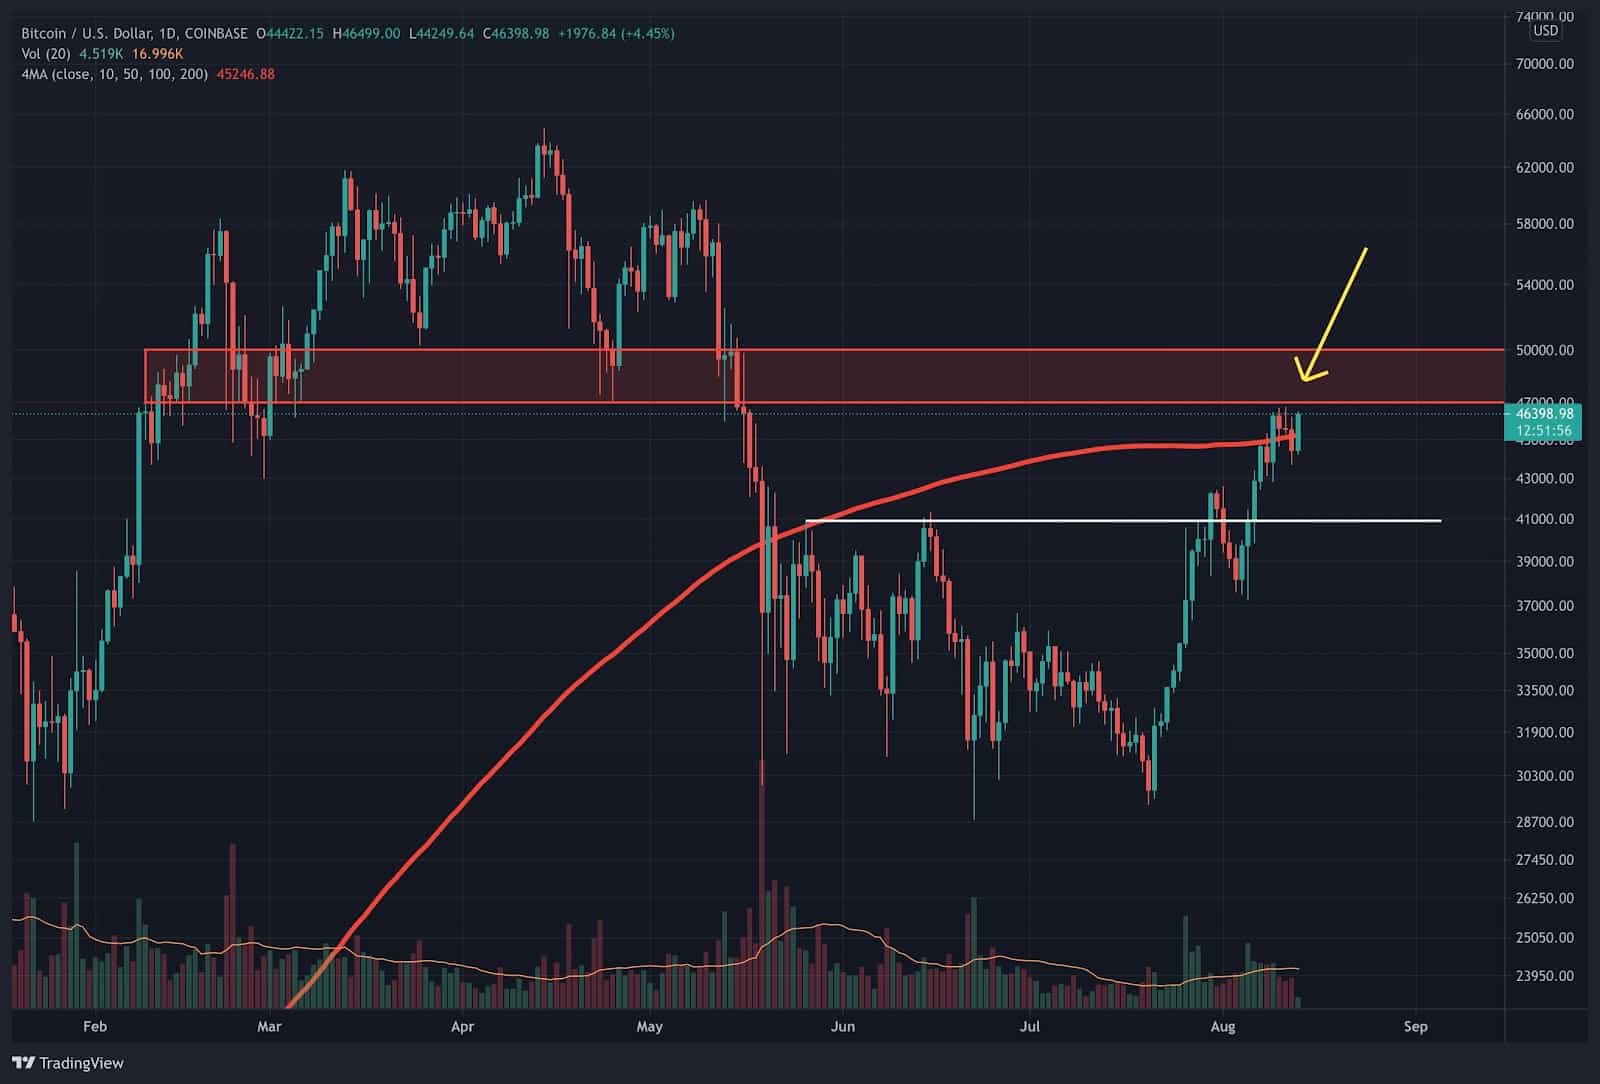
If buying pressure on spot exchanges can absorb this potential incoming supply and shorts in denial continue to get squeezed, this could be the setup that helps BTC break above $50k, turning the technicals even more bullish on a higher time frame.
In the next 24 hours, if BTC can close at the highs, the 3-day close could flash another bullish pulse, and momentum will be getting one step closer to flashing a longer-term buy signal.
BTC bears have been arguing the rally to the 200-day moving average is a bull trap and that whales will use this as an opportunity to dump on retail. So far, on-chain data has contradicted this prediction, instead showing further accumulation and spot buying activity, something critical in a recovery phase after BTC dropped more than 55% from all-time highs.
There is still plenty of work for BTC to do to show price confirmation on the charts. Overall, the on-chain data continues to show strength, and momentum is trending higher. A long-term buy signal has flashed on the hash ribbons, and near-term support has held. The long-term outlook remains bullish, BTC bulls just need price confirmation for continuation.


