Bitcoin Price Analysis: After 2-Days of Stability, The Next Move Is Imminent. The Calm Before The Storm?
So far, April had been a blessing for Bitcoin. The primary cryptocurrency was trading slightly around the $6,000 mark on April 1st, but since then, there was only one way.
There is only one disadvantage in this short-term positive trend: Bitcoin price is back to the recent positive correlation with the global stock markets. Satoshi’s plan was different – if Bitcoin wants to succeed in the long-term, it needs to stand by itself, uncorrelated to equity markets.
Two days ago, on Tuesday, the Bitcoin price saw $600 gains. The price increased into the $7400 – $7500 resistance area. Since then, Bitcoin was trading below the level, with no success of breaking through.
The bottom of the past two days’ range was $7200 (despite one glitch below). On our previous price analysis, we predicted that a correction is likely to take place before breaking the $7400 – $7500 highs.
Altcoins Join The Party
Despite the surge in Bitcoin’s price, the Bitcoin dominance had declined. Money is going back into the crypto markets, buying altcoins like Ethereum – 26% up over the past seven days, Chainlink – 46% over the past seven days, and Tezos – 32% accordingly. Is it just a temp correction? Or is it a new Altcoins season approaching?
Total Market Cap: $209 billion
Bitcoin Market Cap: $133.7 billion
BTC Dominance Index: 63.9%
*Data by CoinGecko
Key Levels To Watch & Next Possible Targets
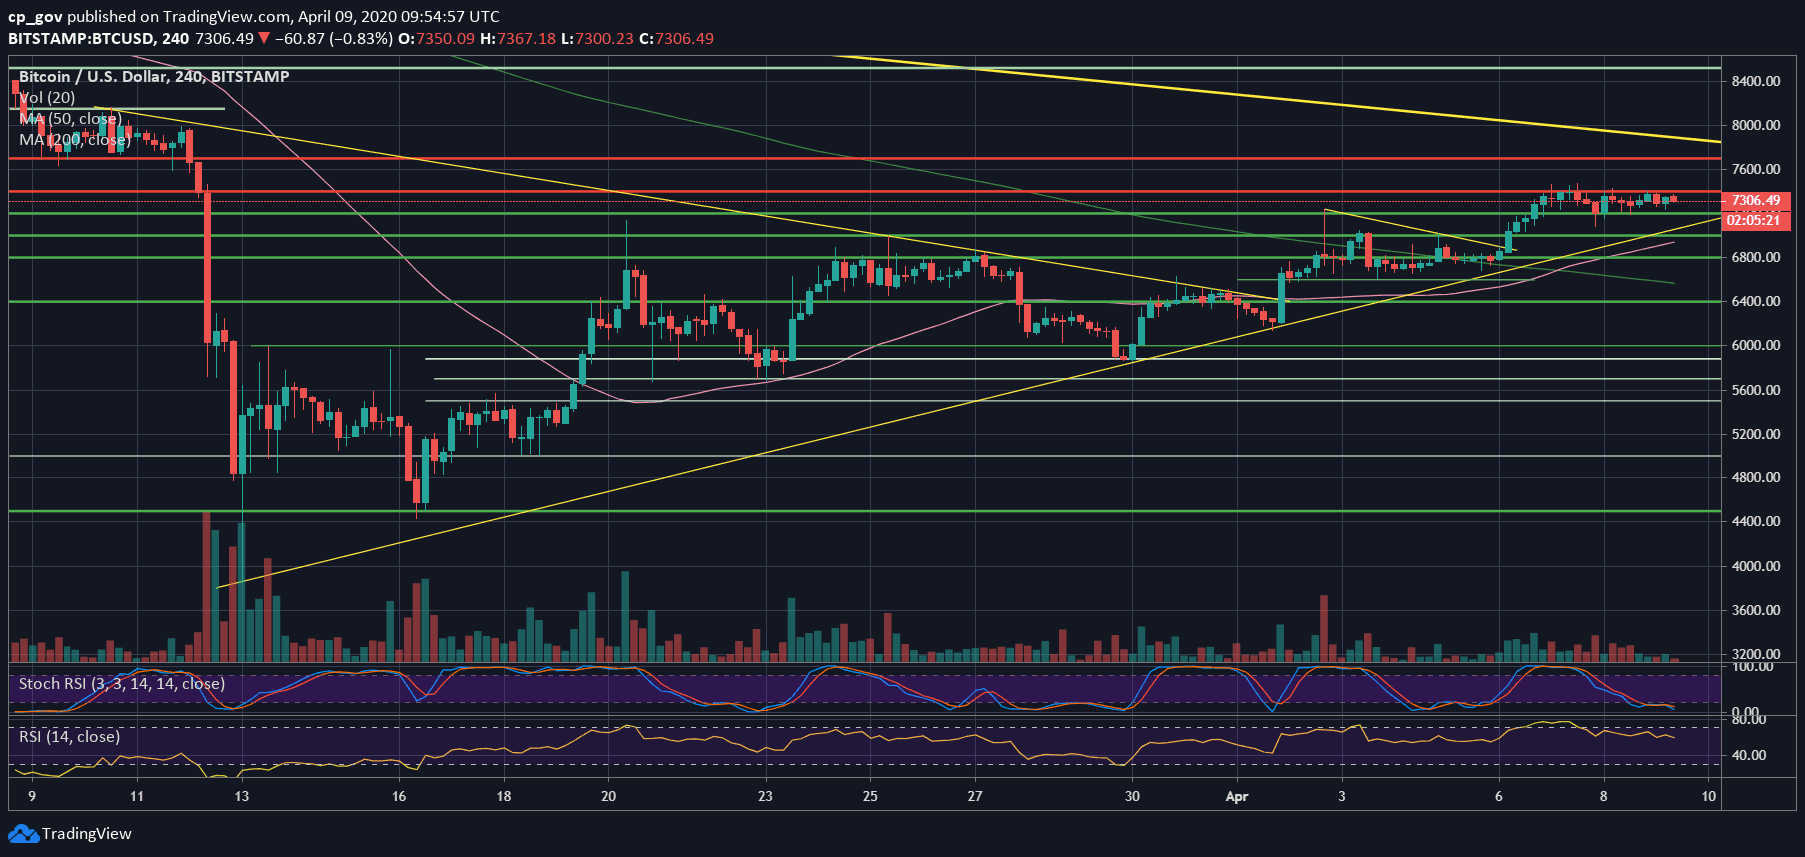
– Support/Resistance levels: Following the breakout, Bitcoin is still facing $7400 – $7500, along with the 50-days MA line (~$7400), as the first level of resistance. In the case of a break-up, we should see Bitcoin reaching higher to $7700 and even higher to $7900 and $8000.
The most crucial resistance area for the short-term will be the $8100 – $8200, which contains both the significant 200-days MA line (light green), as well as the 100-days MA line (white).
If Bitcoin won’t break-up soon, we will likely go below. The initial level of support is the prior resistance at $7200 (the bottom of the past two days). Further below is the ascending trend-line (since March 12) – around $7000. Down below lies $6800, and $6600.
– The RSI Indicator: The RSI is starting to lose patience; however, the crucial 50 area had turned from a tough resistance into the first support. The lower time-frame, the 4-hour’s RSI, is having a little bearish divergence, which we will need to watch out.
– Trading volume: Since the peak last Tuesday, the trading volume had been declining since then. In anticipation of the next big move, which will likely come soon.
BTC/USD BitStamp 4-Hour Chart
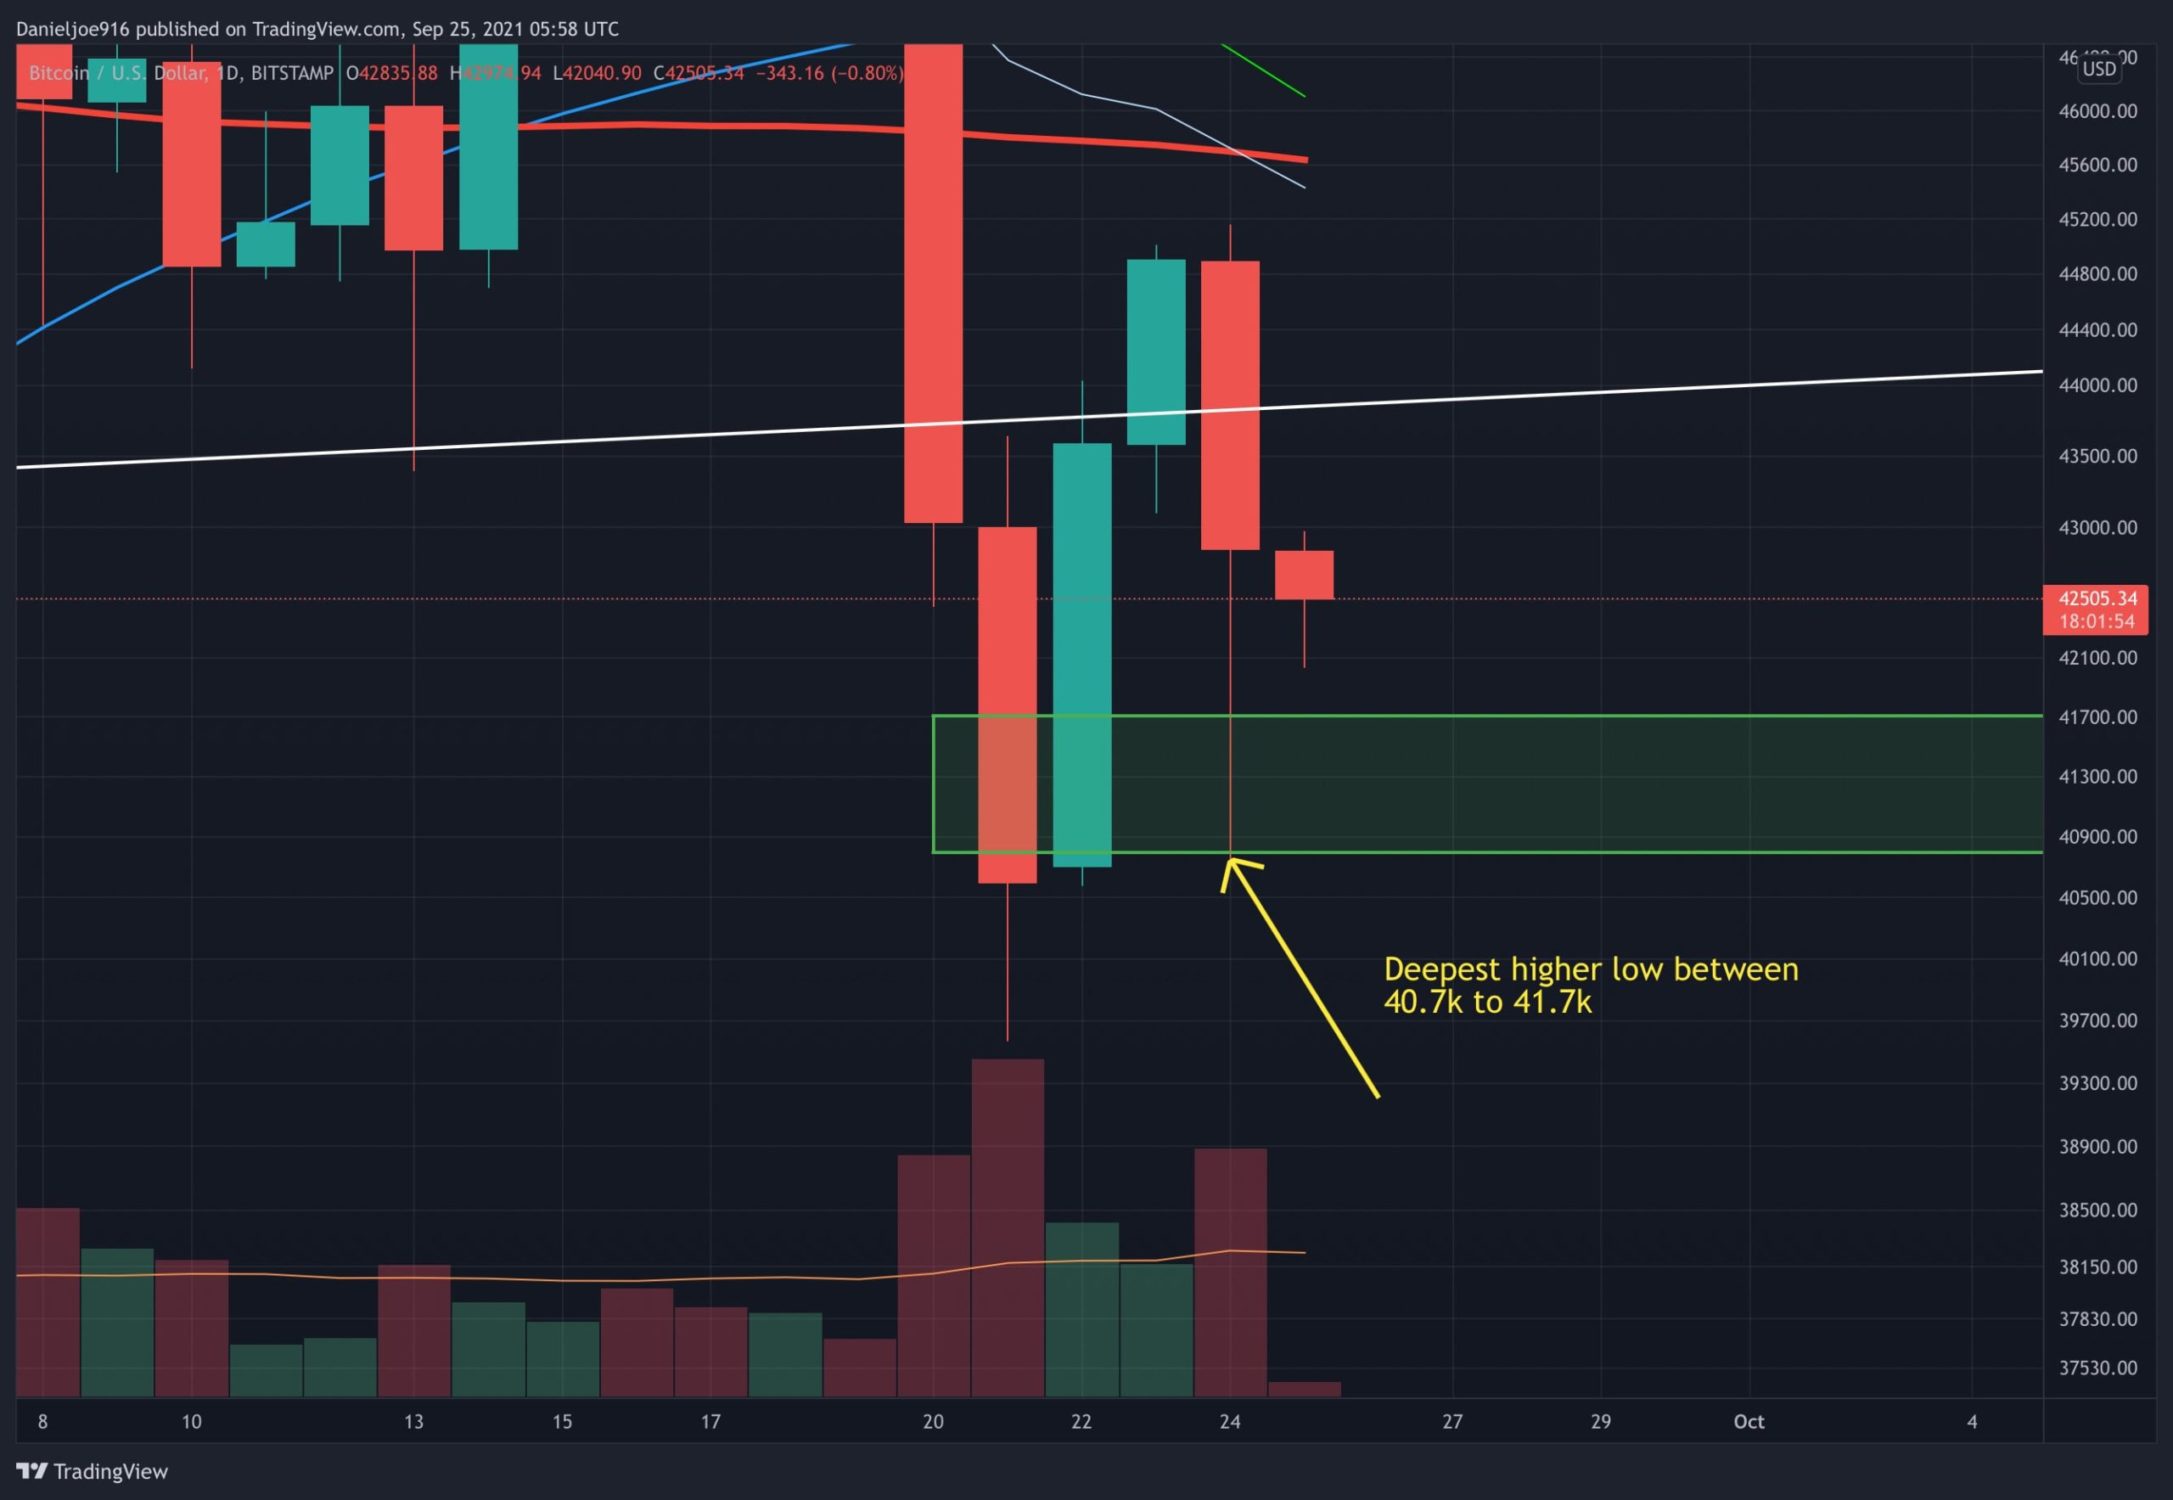
BTC/USD BitStamp 1-Day Chart

The post Bitcoin Price Analysis: After 2-Days of Stability, The Next Move Is Imminent. The Calm Before The Storm? appeared first on CryptoPotato.