Bitcoin Price Analysis: 3 Bearish Signs Suggest $14.6K Retest is Coming
Bitcoin is currently resting along the support of what appears to be an early ascending triangle. Although this pattern is typically a bullish continuation formation, there are 3 concerning factors that suggest BTC prices are about to tumble.
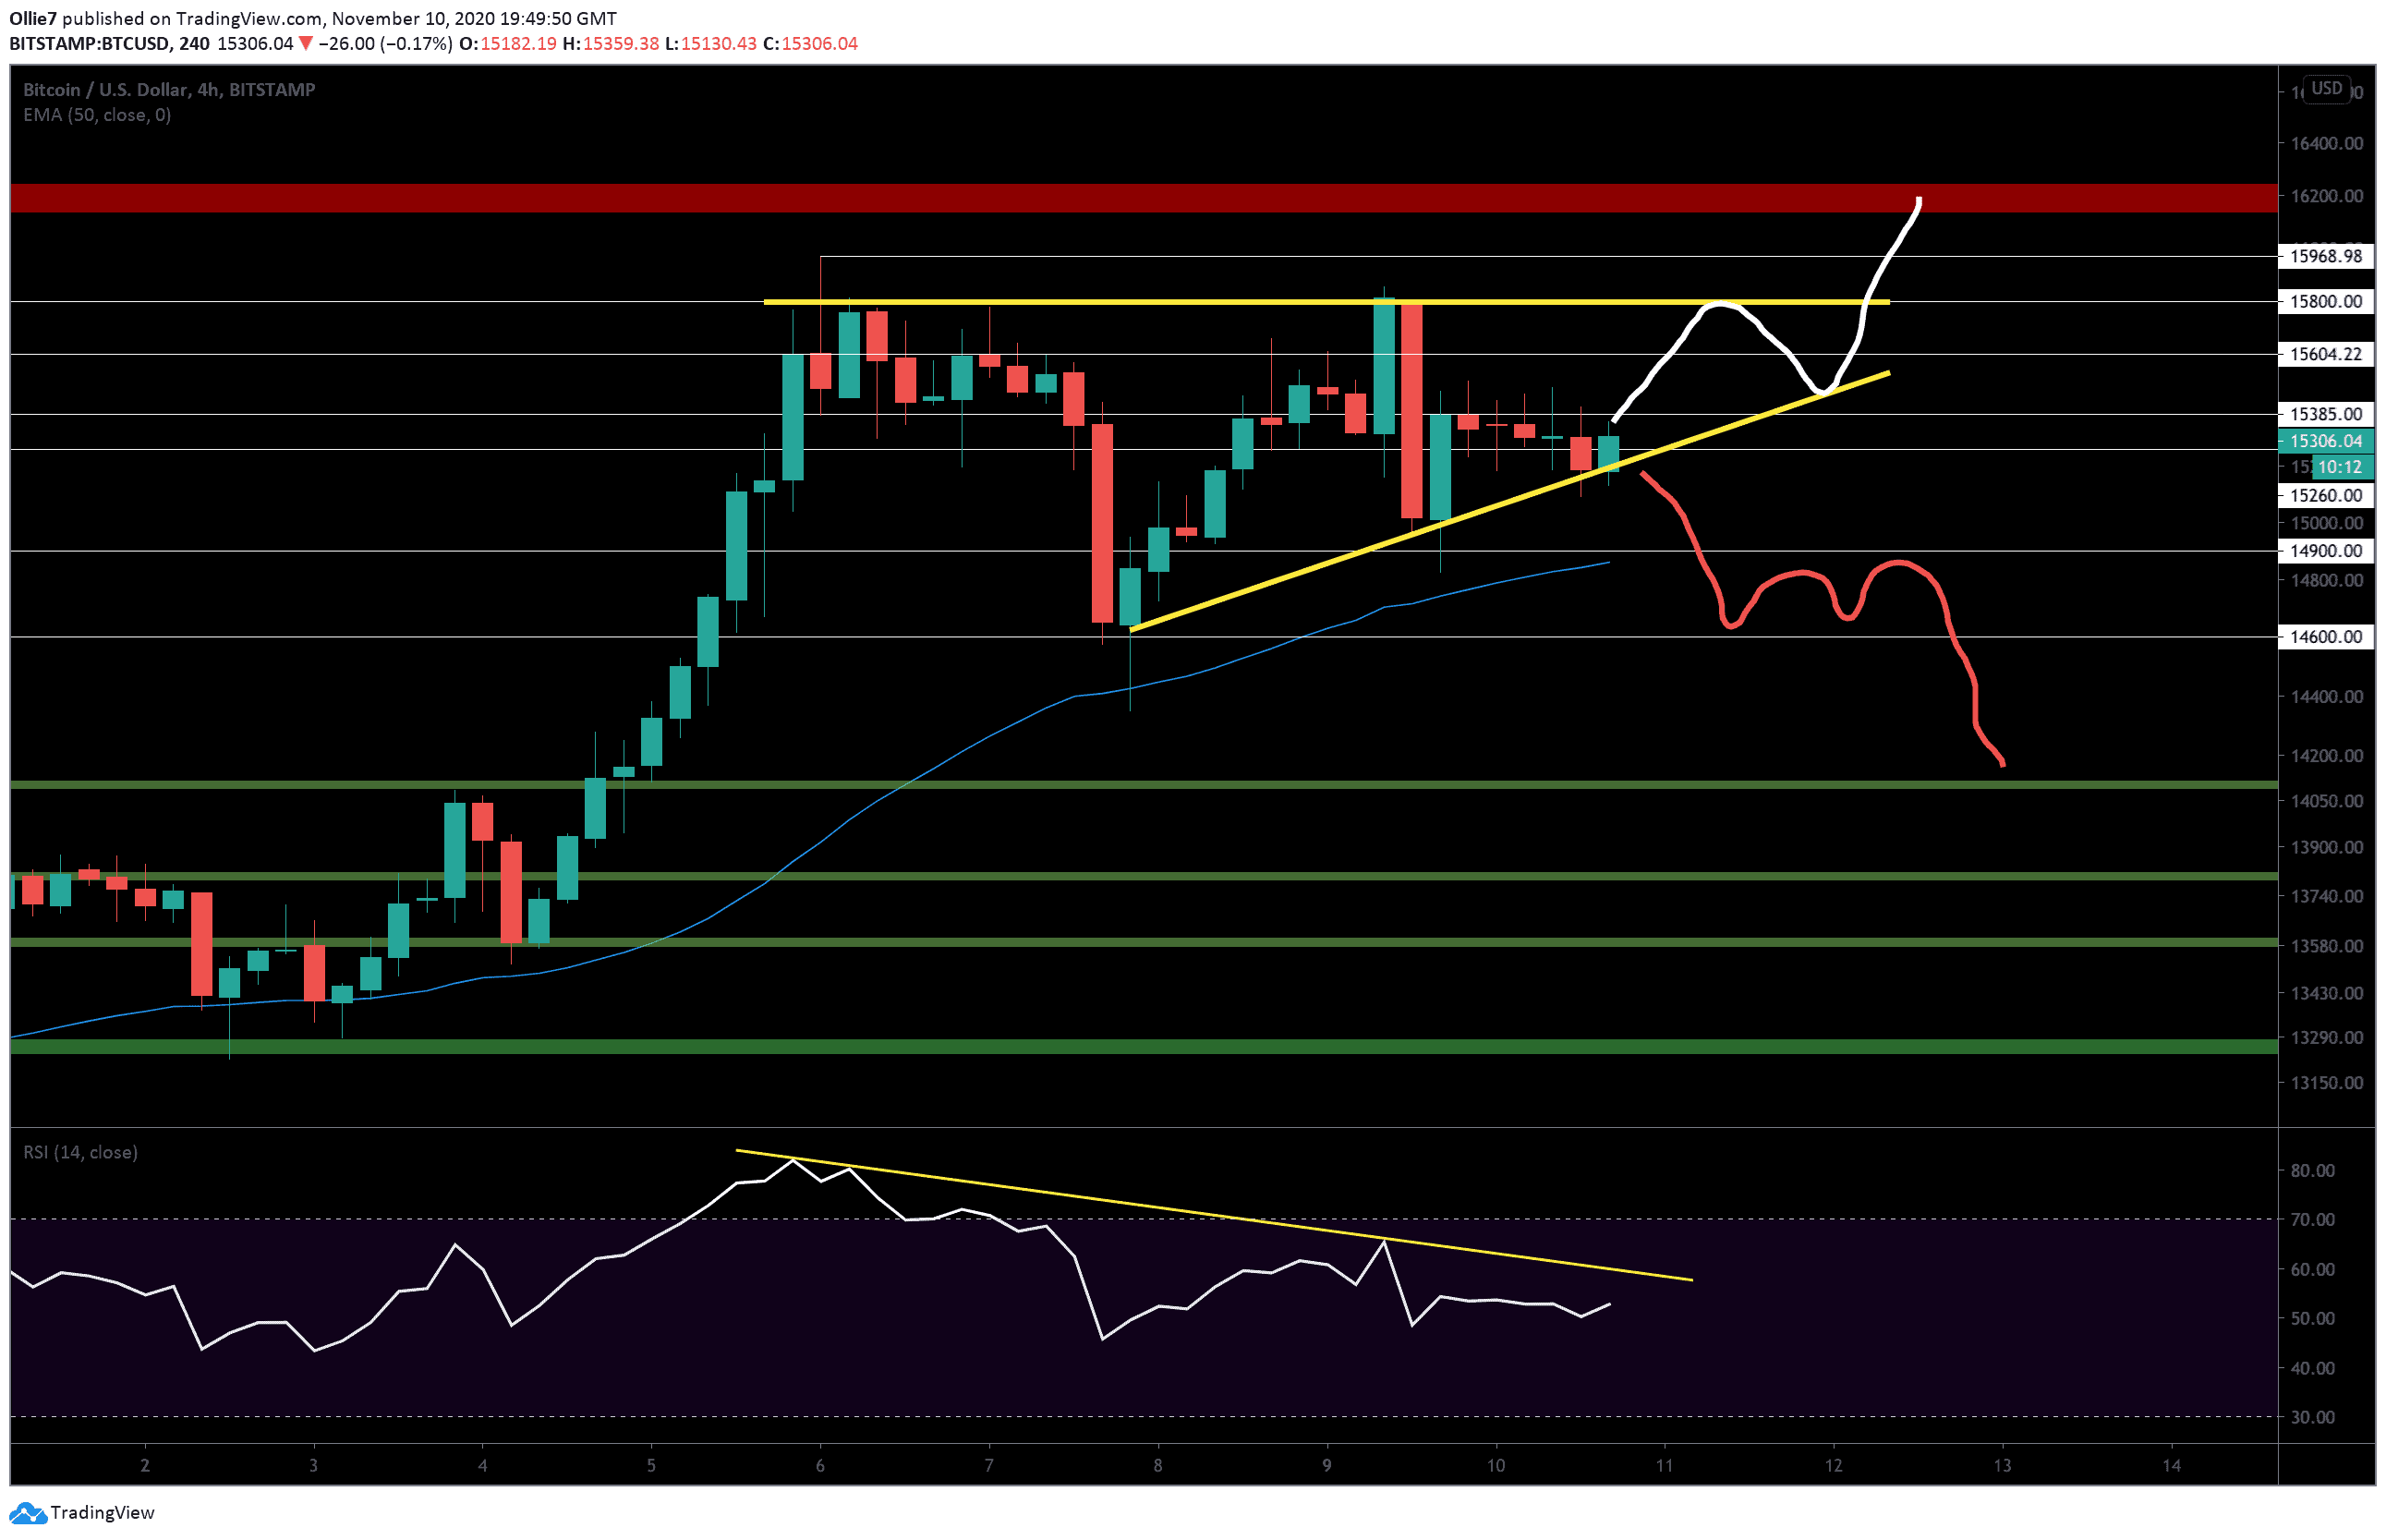
(1) There’s substantial divergence on the 4-hour RSI that indicates the current trend is particularly weak (yellow line on indicator).
(2) Prices are now pushing sideways after yesterday’s failed attempt to close above the former close high at $15,800. Low volatility usually signifies a lack of confidence in the market and precedes a bearish trend reversal.
(3) The global crypto market capital is still stagnating around the $440 billion mark, which supports the theory that bulls are exhausted.
Price Levels to Watch in the Short-term
On the 4-hour BTC/USD chart, it’s clear from the string of small candle bodies that trading activity has slumped significantly in the last 24 hours. Not only this, but the $15,385 resistance appears to be a particularly difficult ceiling for BTC buyers to close above during today’s trading session.
This particular level will be the first intraday target for bulls to break, followed by the $15,600 level and the 4-hour close high at $15,800. If prices can rebound beyond these targets, then the near 3-year high of $15,968 and super psychological $16,000 resistances will be the next major targets for bitcoin buyers.
Beyond the current high, there’s a key daily resistance zone (red) between $16,170 and $16,250 that will likely create some friction if the ascending triangle plays out and bitcoin ascends to new heights (thick white line).
The bearish option, however, seems like the much more likely situation that will play out over the rest of this week (red thick line). If the current support at $15,200 breaks (yellow line), then we could see prices depress as far as the next major support around $14,600, before correcting. After that, we could see the leading crypto asset push sideways for a second time between this level and the $14,900 above before breaking down further towards the $14,600 footing.
It’s worth noting that the 50-EMA (blue) has played a vitally important role over the last month and has propped bitcoin up several times during periods of bearish volatility. Right now, it sits just below the $14,900 mark so let’s see if it can hold back the bears again.
Total market capital:
Bitcoin market capital:
Bitcoin dominance:
*Data by Coingecko.
Bitstamp BTC/USD 4-Hour Chart


