Bitcoin Plunged $700 Away From $12K, But There Is Good News (BTC Price Analysis)
The past week was incredible for Bitcoin. During the previous weekend, the primary cryptocurrency saw its price touching above $12K and dumping to $10,500. A loss of $1600 in a matter of minutes.
However, throughout the past week, the price slowly recovered towards the $12K mark once again. On Thursday, when it seemed that a new 2020 record is coming up, we warned here following a second failure to break the $12,000 resistance mark.
Yesterday Bitcoin plunged to as low as $11,200 (prior resistance turned support) on Bitstamp before the bulls bought the dip, and we’re back at the familiar price area of $11,500 – $11,600 (as of now).
But There Is Good News: Key Levels To Watch
A bull-run with no corrections – which is a parabolic run – is likely to end in a disaster. We all remember the 2017 parabolic bull run to $20K and where the price was a year after – let me remind you: 84% down, around $3120.
What we saw yesterday is a healthy correction to a bullish trend. The fact that the dip was bought quickly showing the strength of the market.
On the lower timeframe, the 4-hour chart, we can see that Bitcoin is forming a symmetrical triangle (marked orange). This triangle will be likely decided on a breakout of $11,800 (to the sake of the bulls) or $11,400 (bearish).
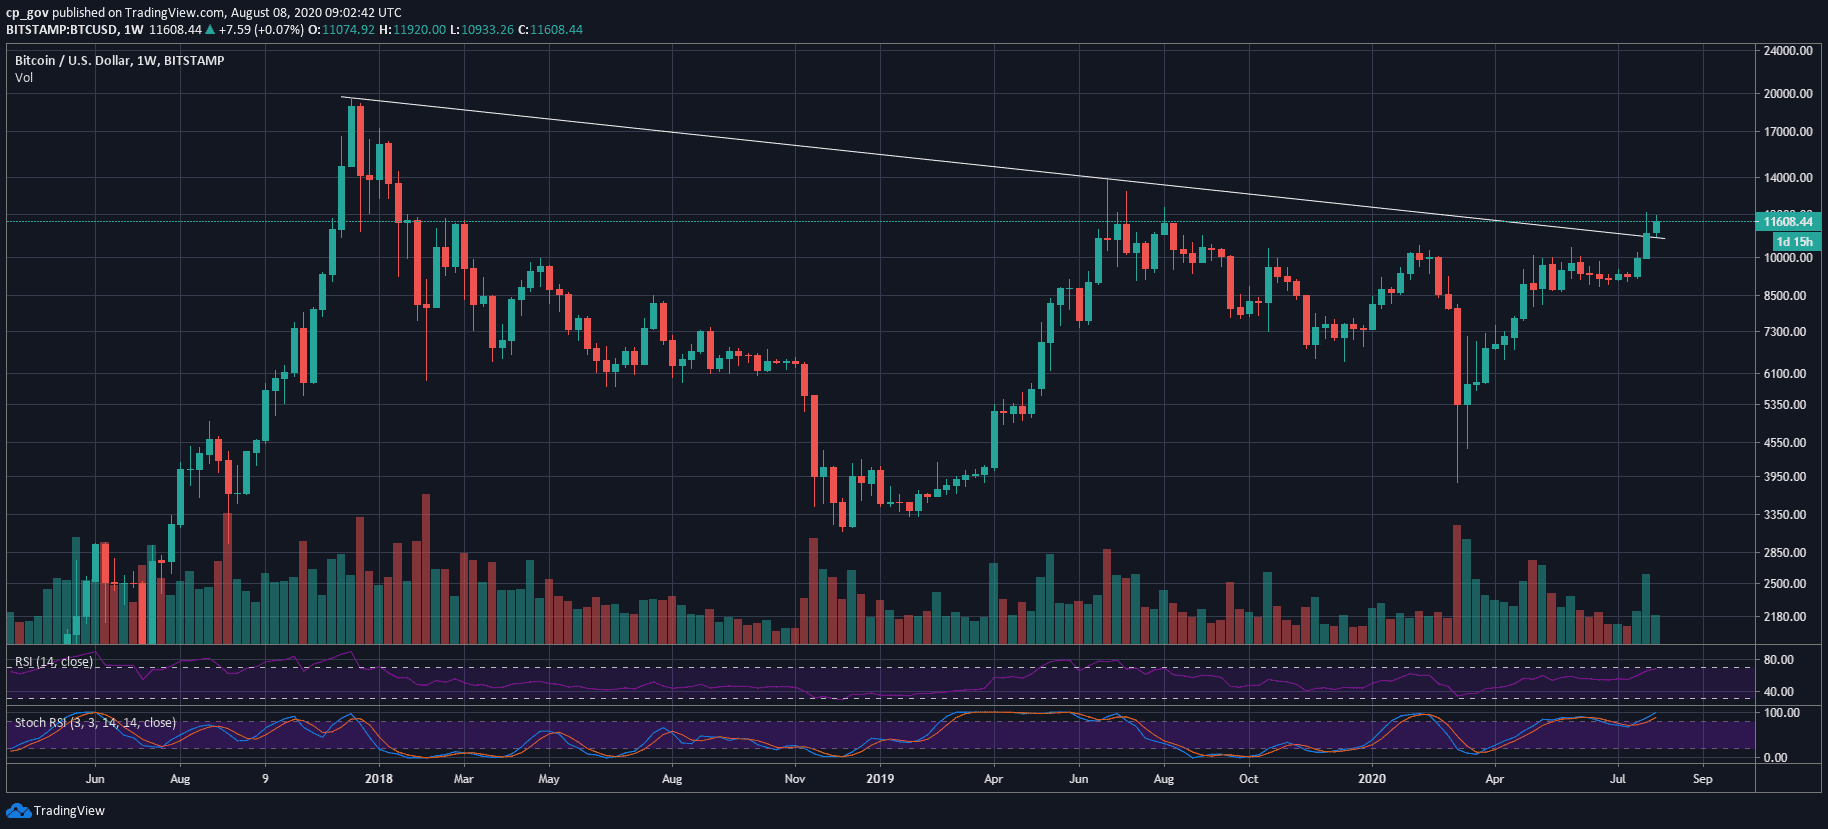
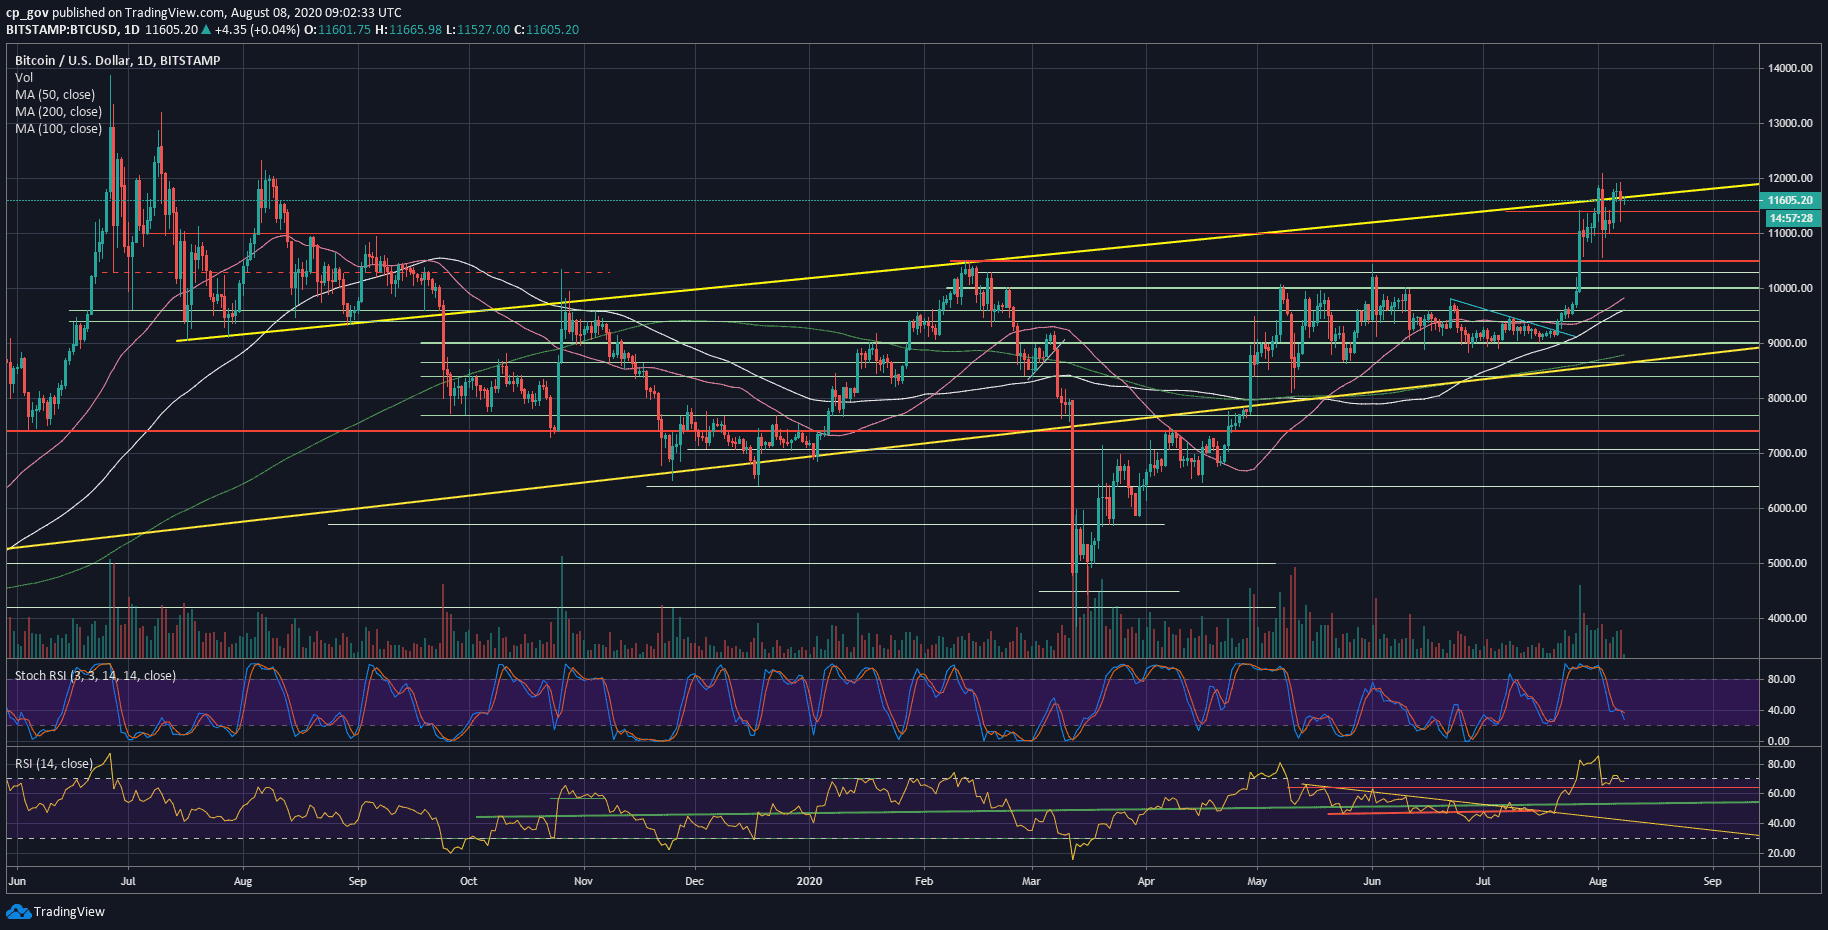
On the macro level – the following daily chart – we can see that the current price area is corresponding with the upper ascending trend-line as strong resistance, which won’t be so easy to break. This line, as can be seen, was begun forming in July 2019.
However, the good news comes from the weekly chart, as seen above. At the longer-term time frame (since 2017), we can see that as long as Bitcoin holds the $10,500 – $10,800 area – the bulls are in control. After the impressive breakout of the descending trend-line, it would be reasonable to retest the line and confirm it as support, before continuation to new sky highs.
Total Market Cap: $350.7 billion
Bitcoin Market Cap: $214 billion
BTC Dominance Index: 61.0%
*Data by CoinGecko
BTC/USD BitStamp 1-Day Chart
BTC/USD BitStamp 4-Hour Chart

The post Bitcoin Plunged $700 Away From $12K, But There Is Good News (BTC Price Analysis) appeared first on CryptoPotato.