Bitcoin Plunged $1800 Following a Violent Correction. Are The Bulls Still Around? BTC Price Analysis
Following a crazy rally, it finally happened: Bitcoin plunged $1800 in a large red candle, driving down the price to a low of $6180 on Bitstamp.
As written here before, we had a strong clue on what was going to happen:
“Add to that a recent significant drop in the short positions caused a daily 38% decrease, as the short positions are now at their lowest point over the past year. The number currently stands around 17K BTC open short positions. As a reminder, a situation where shorts are at their lower levels and longs at their high create the perfect settings for a long-squeeze.”
Does this mean Bitcoin is bearish again? It’s early to say so. So far, the anticipated correction is very aggressive but looks healthy and aggressive as this was on the way up. Besides, we mentioned here the importance of the $5700 – $6000, which was what held the market during the bear year of 2018. As long as this area hadn’t broken down, I would say that the correction is violent, but healthy.
And last, Tone Vays was right!
Total Market Cap: $255 Billion
Bitcoin Market Cap: $142.5 Billion
BTC Dominance: 55.9%
Looking at the 1-day & 4-hour charts
– Support/Resistance:
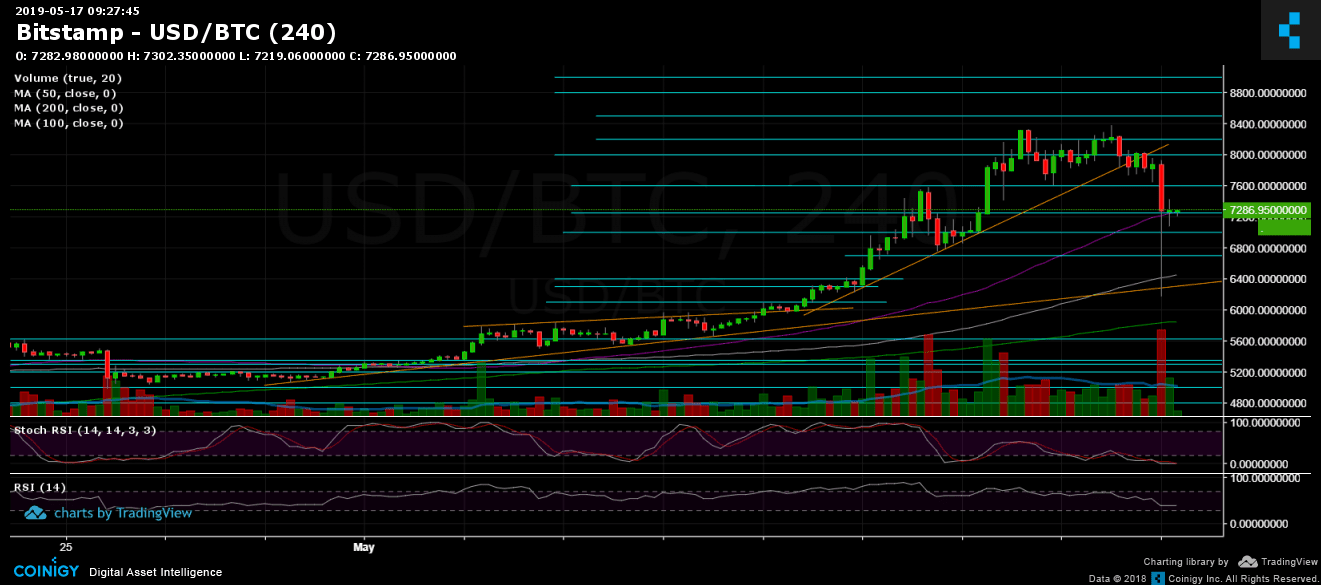
Following the break-down of the mid-term descending trend line on the 4-hour chart, it didn’t take long, and the dump came across. As can be seen, the wick of the 4-hour candle had reached the longer-term ascending trend-line support, along with Fib level 78.6%.
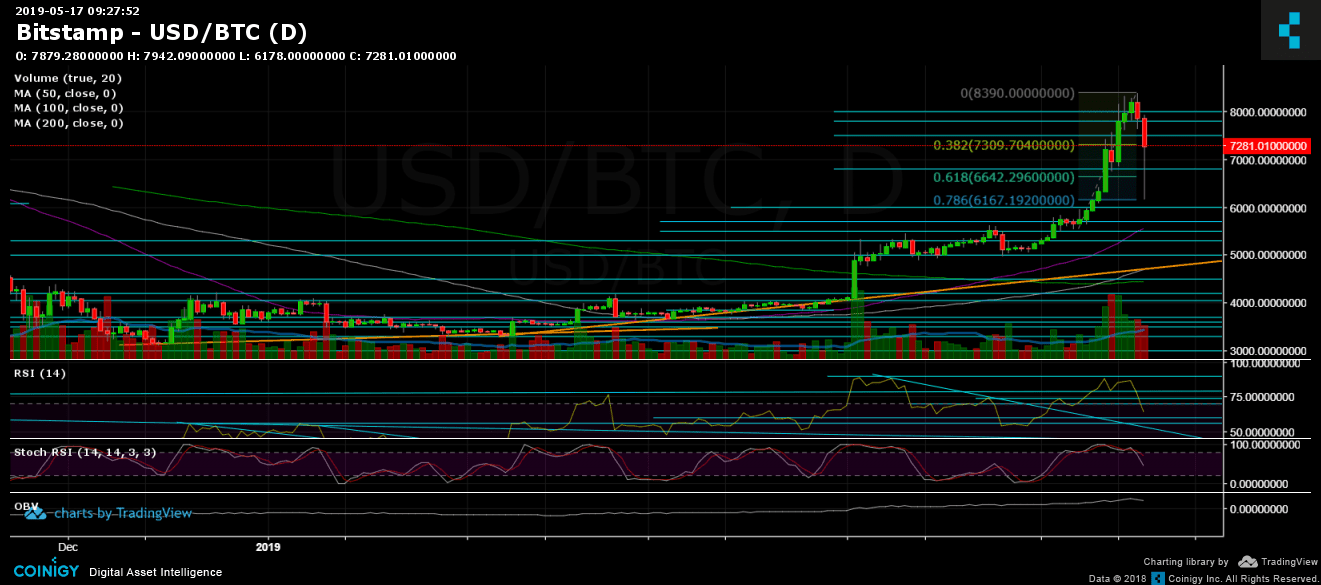
As of now, Bitcoin is testing support at $7250 – $7300 (along with Fibonacci retracement level 38.2%). From below, the next significant support area lies at $7000. Further below is $6700 (along with Fib level 61.8%), $6400 and $6300.
From above, the next significant resistance is the current price area, while further support turned resistance level lies at $7600, $8000, $8200, and 2019 high at $8400.
– Trading Volume: The recent dump was followed by a massive amount of funds. It’s ok to have an ugly correction like this, but the next days will tell if the sellers had returned.
– Daily chart’s RSI: The RSI had also dropped sharply. As of now, it’s still in the bullish territory (63); however, there is always more room to go down.
– BitFinex open short positions: since yesterday, we hadn’t seen the opening of new short positions as the number increased just a little to 16.7K BTC open short positions. From the other side, and supporting the long-squeeze theory we mentioned, the open longs had sharply decreased by 10%.
BTC/USD BitStamp 4-Hour Chart
BTC/USD BitStamp 1-Day Chart
The post Bitcoin Plunged $1800 Following a Violent Correction. Are The Bulls Still Around? BTC Price Analysis appeared first on CryptoPotato.