Just yesterday, we mentioned the impressive Bitcoin recovery. However, we also wrote that danger remained.
Yesterday’s move, in anticipation of the first congressional hearing regarding Facebook’s Libra, reminds me of another critical date from Bitcoin’s short history: January 4, following the Winklevoss Brothers’ Bitcoin ETF denial (or delay of approval).
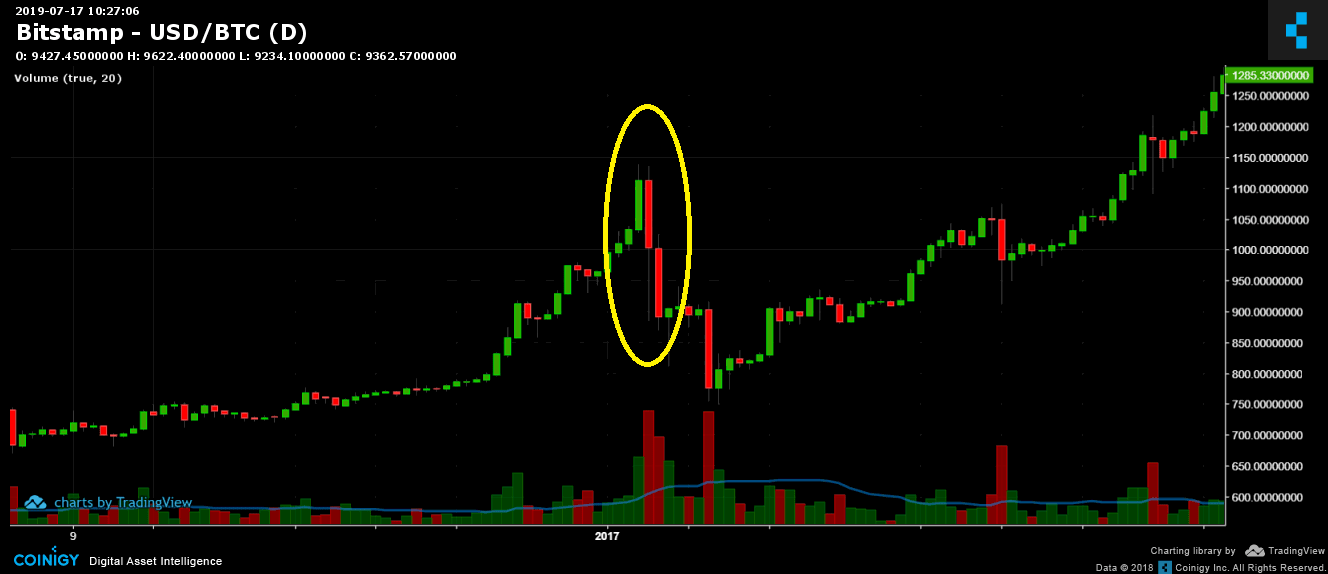
On the following chart, the candle from that day is marked by the yellow circle. We see Bitcoin surging, in what looks like a classic short squeeze, and from there plunging. On that day, Bitcoin’s price saw a high of $1,136 and a low of $885, which was approximately a 23% turnover in its value.
Winklevoss ETF delay, January 4 2017
Yesterday was very similar: Surge (short squeeze) up to the $11,000 resistance area, followed by a plunge following the hearing and the negative outcomes for the cryptocurrency world. Bitcoin broke the key-level 50-day moving average (marked in purple on the daily chart at $9850, which was the bottom from two days ago). It then broke the lower ascending trend line, along with $9,600 which had been the low following the recent parabolic move as well as the $9,400 support (the high from June).
The outcome was devastating: a lower low on the daily chart, which turned the trend to bearish.
We also mentioned the RSI, which departed bullish territory and created another lower low. That could have helped predict this outcome (the negative divergence in the RSI). The RSI is now at 42, which is its lowest level since February of this year. The sad thing is that there is more room to go down.
Total Market Cap: $252 billion
Bitcoin Market Cap: $166 billion
BTC Dominance Index: 66.0%
*Data by CoinGecko
Key Levels to Watch
Support/Resistance: Bitcoin broke all mentioned support lines from yesterday and is now facing crucial old support areas. The nearest levels lie at $9,000 and $8,800. Between $8,800 and $8,500, there is a steady supply zone which could help the bulls. $8,500 is also a long-term Fibonacci retracement level. Further below lies $8,200, $8,000, $7,600 and $7,200, which is also a Fibonacci retracement level from the last move.
From above, $9,400 is the nearest support-turned-resistance level. Higher above lie $9,600, $9,800 and $10,000. Further up are $10,300, $10,600 and $11,000.
– Daily chart’s RSI: Discussed above. The Stochastic RSI oscillator is greatly oversold, but it hasn’t entered the bullish zone yet.
– Trading Volume: Yesterday’s sell-off was followed by a huge amount of volume. There are still sellers around with bags to sell, according to yesterday’s volume candle.
BTC/USD Bitstamp 1-Day Chart
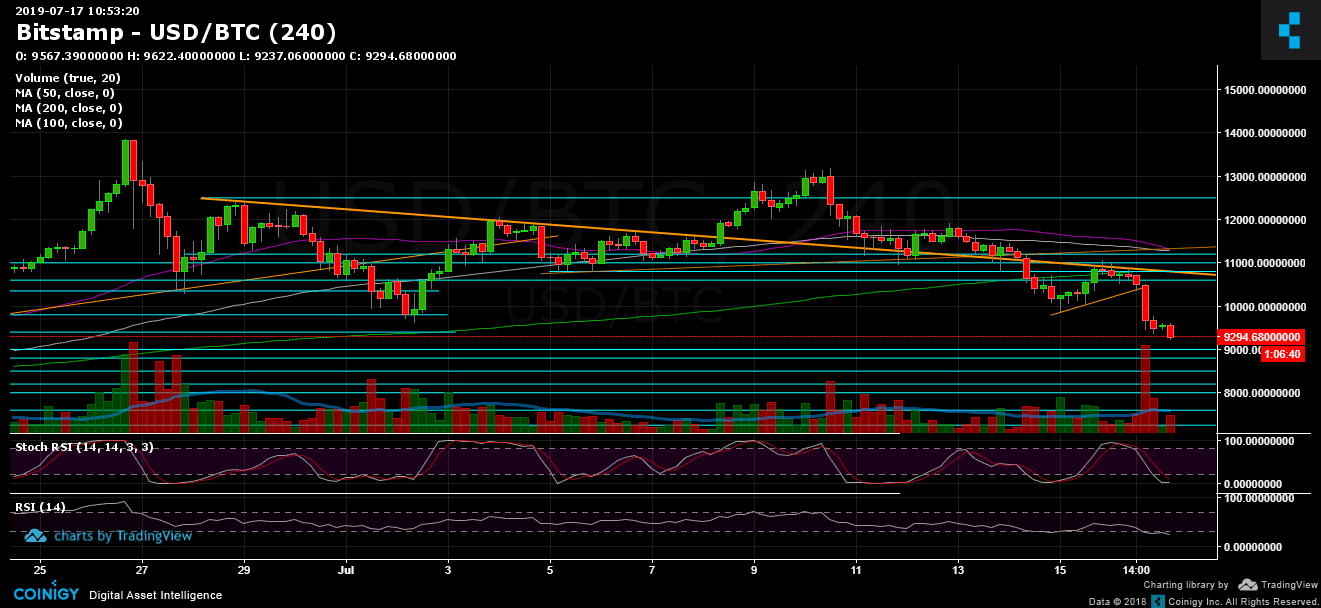
BTC/USD Bitstamp 4-Hour Chart
The post Bitcoin Plunge Recalls a Crucial Decision Day From 2017: Will $8,500 Stop the Bleeding? appeared first on CryptoPotato.
From our last Bitcoin price analysis: “Breaking down the $7000 – and the important $6800 will be the test level. There is a very strong support term”. As of writing these lines, seems like the $6800 support holds, but, during the next day Bitcoin is going to be tested with a significant resistance level: The…
On Wednesday morning in Abu Dhabi, Binance and Circle announced a strategic partnership to promote USDC, a stablecoin jointly owned by Circle and Coinbase. The collaboration comes as stablecoins gain traction in mainstream finance and competitors seek to challenge the dominance of market leader Tether. The Alliance Details about revenue sharing in this arrangement remain
[PRESS RELEASE – New York, New York, September 12th, 2024] Leading web3 accelerator program Beacon has announced the launch of its fourth and largest cohort to date. Beacon, which finances projects from pre-seed to Series A, has selected 17 promising companies for its latest three-month program, marking a significant expansion from previous cohorts. The latest
On a more long-range timescale, BTC is down 11% over the 6-month window. While it is trading up 60% YTD, Bitcoin is still down 60% from its ATH. The king crypto’s all-time high price briefly reached $68.5K back in Nov 2021. Will Bitcoin continue to tumble through the end of the year? Or will an
Despite bitcoin’s price turmoil over the past week, Ki Young Ju, the founder and CEO of the market analytics platform CryptoQuant, believes the leading digital asset’s dominance is less likely to decline soon. Historical data shows that alternative cryptocurrencies (altcoins) have always rallied when BTC retraces and seen a decline in market dominance during bull
Shibarium has announced its relaunch with a successful operation owing to assistance from an individual outside its own circle. In a final update, Shibarium went live with its relaunch, boasting a successful operation, accumulating over 65,000 wallets and handling 350,000 transactions before the official Aug. 28 announcement. Shytoshi Kusama, Shiba Inu’s lead developer and co-founder,…
Bonk’s price settled Monday to 0.000049 Monday after a 14-day melt-up to a new all-time high price at the 0.000055 handle. “Holy sh**!” exclaimed Shawn.eth (Punk #4220), a Bonk investor on X Monday. “My $BONK bag was $30,000 when j bought and now its $2,300,000,” Shawn.eth wrote. “Bonk started the entire memecoin supercycle early last
Investors face their last chance to buy Sealana at presale after a high-octane campaign. It has raised over $5 million in presale funding, signaling a huge nod of approval from traders. However, the presale will end in one day, on June 25 at 6 PM UTC. This means it’s the last chance for prospective buyers
Bitwise CIO Matt Hougan said Monday that he views the weekend’s violent selloff in crypto/equities as a Bitcoin buying opportunity. In a Twitter thread Monday, the executive likened the market crash to March 12, 2020 – a day of “chaos” that pre-empted historic new highs for crypto over the following months. Bitcoin Buying Opportunity, Says