Bitcoin Plunge Flashbacks a Crucial Decision Day From 2017: Will $8,500 Stop The Blood? BTC Price Analysis
Just yesterday, on our previous analysis, we mentioned the impressive Bitcoin recovery. However, we also said that the danger is up and live.
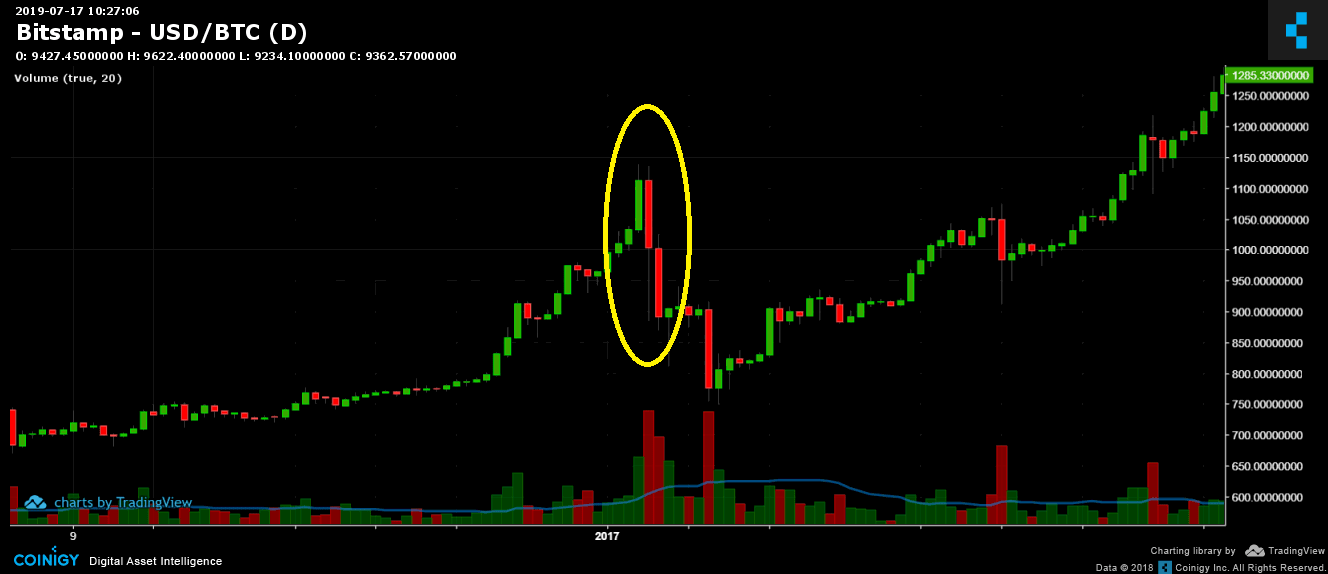
The move from yesterday, in anticipation to the congressional hearing regarding Facebook’s Libra, reminds me of another critical date from Bitcoin’s short history: On January 4, following the Winklevoss brother’s Bitcoin ETF denial (or delay of approval).
As can be seen on the following chart, the candle from that day is marked by the yellow circle. We see Bitcoin surging, in what looks like a classic short squeeze, and from there plunging. At that day, Bitcoin’s daily trading saw a high of $1136 and a bottom of $885, which is approximately 23% turnover in its value.

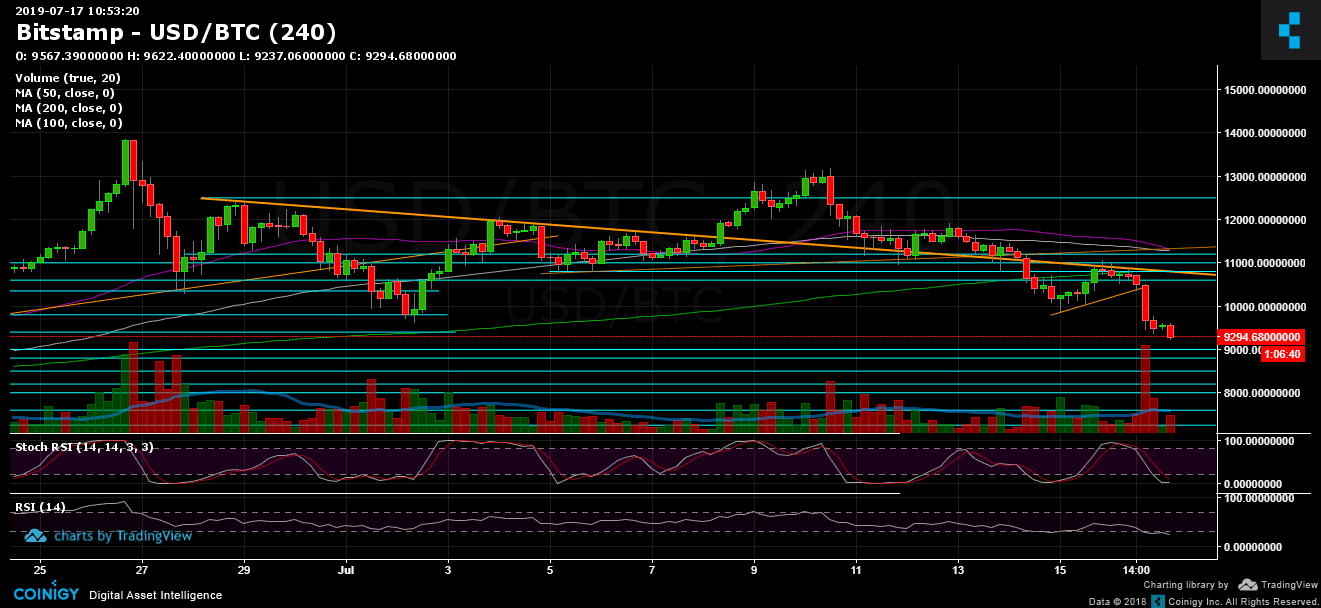
Yesterday was very similar: Surge (short squeeze) up to the $11,000 resistance area, followed by a plunge upon the hearing and the negative outcomes for the cryptocurrency world. Bitcoin broke down the key-level 50-days moving average (marked in purple on the daily chart, at $9850, which was the bottom from two days ago) continued down to violently breaking down the lower ascending trend-line, along with $9600 which was the low (following the recent parabolic move) and the $9400 support (which was the high from June).
The outcome is devastating: a lower low on the daily chart, which turned the trend to bearish.
We also mentioned here the RSI, which left the bullish territory and created such lower low before. That could’ve been forecasting this outcome (the negative divergence in the RSI). As of now, the RSI is at 42, which is the lowest level of the indicator since February this year. The sad thing is that there is more room to go down here.
Total Market Cap: $252 billion
Bitcoin Market Cap: $166 billion
BTC Dominance Index: 66.0%
*Data by CoinGecko
Key Levels to Watch
– Support/Resistance:
Bitcoin broke down all mentioned support lines from yesterday, and is now facing crucial old support areas. The nearest level lies at $9000 and $8800. Between $8800 and $8500, there is a steady supply zone, which can help the bulls. The $8500 is also a long-term Fibonacci retracement level. Further below lies $8200, $8000, $7600 and $7200, which is also a Fibonacci retracement level to the last move.
From above, $9400 is the closest support turned resistance level. Higher above lies $9600, $9800 and $10,000. Further up is $10,300, $10,600 and $11,000.
– Daily chart’s RSI: Discussed above. Stochastic RSI oscillator is far at the oversold territory, however, hadn’t entered the bullish zone yet.
– Trading Volume: Yesterday, sell-off was followed by a huge amount of volume. There are still sellers around holding their bags to sell, according to yesterday’s volume candle.
BTC/USD BitStamp 1-Day Chart
BTC/USD BitStamp 4-Hour Chart

The post Bitcoin Plunge Flashbacks a Crucial Decision Day From 2017: Will $8,500 Stop The Blood? BTC Price Analysis appeared first on CryptoPotato.


