Bitcoin Mining Firm Luxor Raises $5 Million In Round Led By NYDIG
Bitcoin mining company Luxor Technology has raised $5 million in a round led by NYDIG, which will also partner with Luxor on mining projects.
Luxor Technology Corporation, a bitcoin mining pool and software company, has announced the conclusion of a $5 million series A financing round led by institutional Bitcoin firm NYDIG.
According to a release sent to Bitcoin Magazine, Luxor and NYDIG will also collaborate on mining-related and hash rate products. Mining groups Blockware Solutions, Celsius Network, DPO, Navier and Supplybit also participated, as did Bitnomial, Hodl Capital and Routemaster.
Luxor has offered products like Hashrate Index, a platform for transparent information on the revenue bitcoin miners should expect; North American bitcoin mining pool software servers; and Luxor Switch, a profit-switching algorithm that transfers miners’ hash rates between different blockchains and pays them in bitcoin.
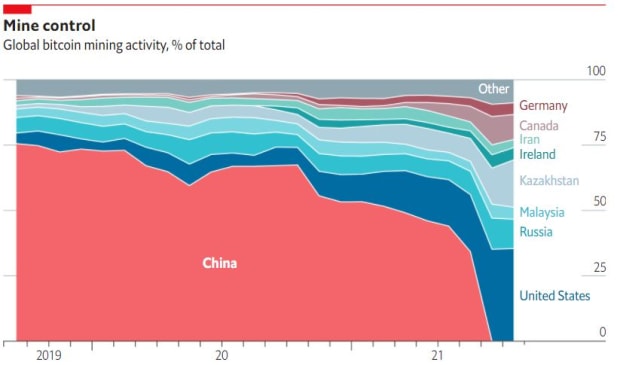
Statements in the release positioned the partnership between Luxor and NYDIG as one that would hasten the migration of more global Bitcoin hash power to North America. Currently the majority of this hash rate comes from mining pools based in China, but the landscape appears to be shifting.
“Luxor is uniquely positioned to capitalize on industry tailwinds that see hash rate continuing to migrate to North America,” said Nick Hansen, the CEO of Luxor, per the release. “With NYDIG’s exceptional track record, reputation and talent we will be able to revolutionize the way hash rate is harnessed, valued, traded and hedged.”


