Bitcoin, Magic Bubbles And History
While bitcoin has faced many short-term bubble scenarios in the past, its redeeming qualities have remained consistent.

My son recently celebrated his fifth birthday. We had a party for him and we did the obligatory “party packs” for the children. The highlight was the bubbles. It always is. The kids ran around and showered one another in bubbles. But there weren’t as many bubbles at that party as there have been bitcoin bubble-critics, some of whom are world-renowned intellectuals.
I can’t help but look at these critics in the same way I looked at the kids at my son’s party. I don’t mean that in a condescending way. I couldn’t be condescending toward these intellectual giants, even if I wanted to be. But honestly, how else do you look at someone who can’t (or simply won’t) assume a wider perspective?
It is entirely true that bitcoin did, at various stages in its 13-year history, enter “bubble-territory” where the price was due for a major correction. But describing bitcoin itself as a bubble (in its entirety) ignores any comparison between its price history and that of other infamous bubbles.
But before I go any further I have to put a disclaimer here. I am not qualified to draw conclusions based on the technical analysis of price charts. This article only attempts to make a generalized comparison between what we know were bubbles, and bitcoin’s price history. Based on that it should be pretty clear that, whatever it is, bitcoin is something other than what is usually described as a bubble.
Bubbles pop. And while markets may recover, bubbles certainly do not re-inflate themselves again and again. If bitcoin is a bubble, it’s a magic bubble. It would be something that exists in an entirely new category unlike any other bubble we’ve ever seen before.
Having recently set a new all-time-high at over $68,500, the bitcoin price surpassed it’s previous all-time high of $64,000 from April 2021. Which, in turn, surpassed the December 2017 all-time high of $20,000. This has happened FIVE times in less than 13 years.
Not only that, but soon after bitcoin entered what traditional experts labelled “bubble territory” during these new successive all-time high peaks, a catastrophic “crash” of 50% – 80% always followed — only for the price to consolidate again, then build to new all-time highs at levels multiple times higher than previous records, all within relatively short periods of time. This pattern has played itself out around record highs set in mid-2011, late-2013, late-2017, April 2021 and now again in November 2021.
BTC – $1. Bubble, crash. Consolidate.
BTC – $10. Bubble, crash. Consolidate.
BTC – $100. Bubble, crash. Consolidate.
BTC – $1,000. Bubble, crash. Consolidate.
BTC – $10,000. Bubble, crash. Consolidate.
BTC – $100,000 – ?
Bitcoin resembles a phoenix rising from the ashes of its own obituaries, far more than it resembles a bubble. It has been pronounced dead multiple times since 2010 and yet, despite multiple major corrections, bitcoin has maintained a 200% annualized rate of return through all of it.

And simply put, other asset bubbles typically don’t do that.
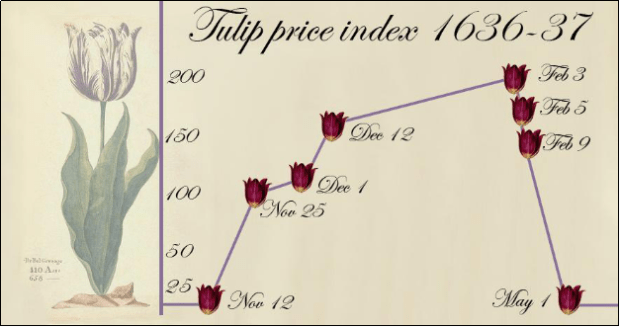
In fact, none of history’s most famous bubbles have done that.

The Dutch tulip mania (early 1600’s) did not, nor the South Sea Company (1700’s), the Wall Street Crash of 1929 prior to the Great Depression, the dot com boom (late 1990’s) or the U.S. housing bubble of the mid 2000s that led to the Great Recession of 2007- 2009.
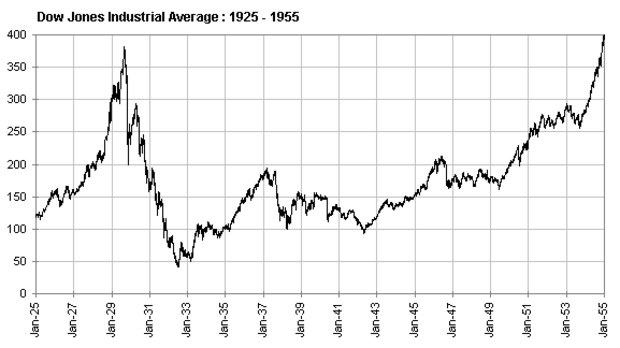
All entered inflated bubble territory, crashed and never recovered. Or did recover, but within no less time than a decade or more.

But none of those, not even the U.S. housing bubble, crashed and re-inflated within less than ten years. Let alone FIVE times within just over a decade at levels multiple times higher than before.

This makes the notion that bitcoin is a bubble less likely each and every time bitcoin does its thing. And, instead of several consecutive magically self-reinflating bubbles, even the hardcore skeptic must admit it’s beginning to look like waves of adoption.
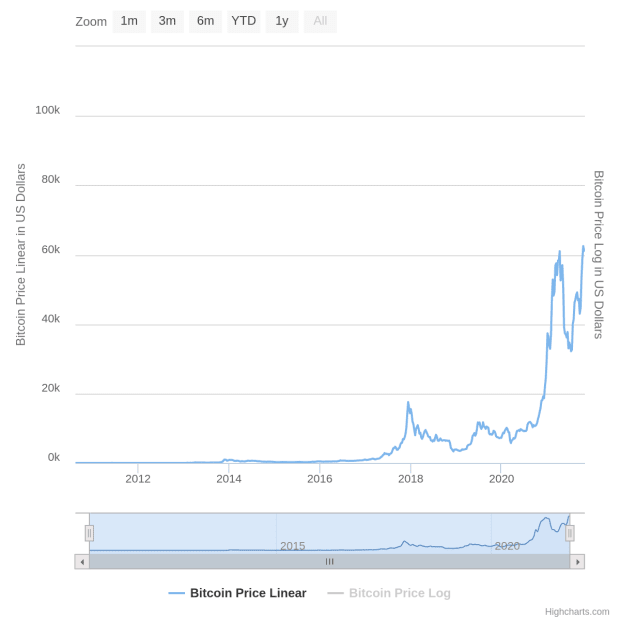
Above is bitcoin’s all-time price history in simple linear terms, but it is deceiving because it does not give the full picture of what happened in 2011, 2013 and 2017. Seen in linear terms, 2020 and 2021 completely overshadows the other “bubbles.”

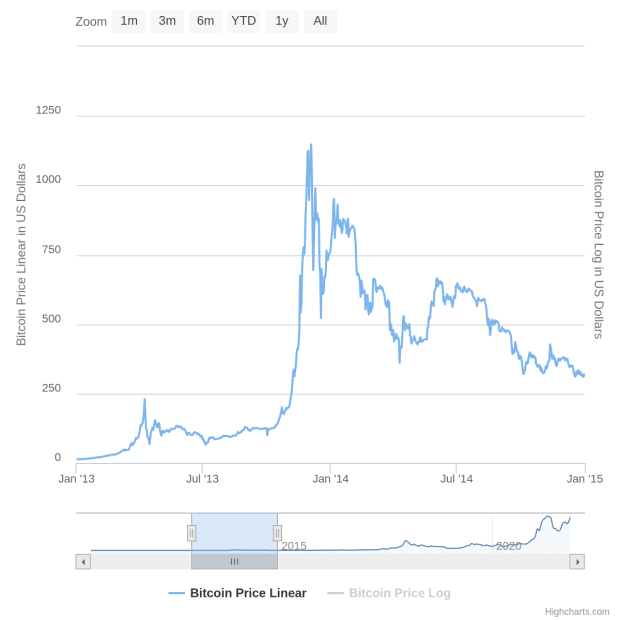
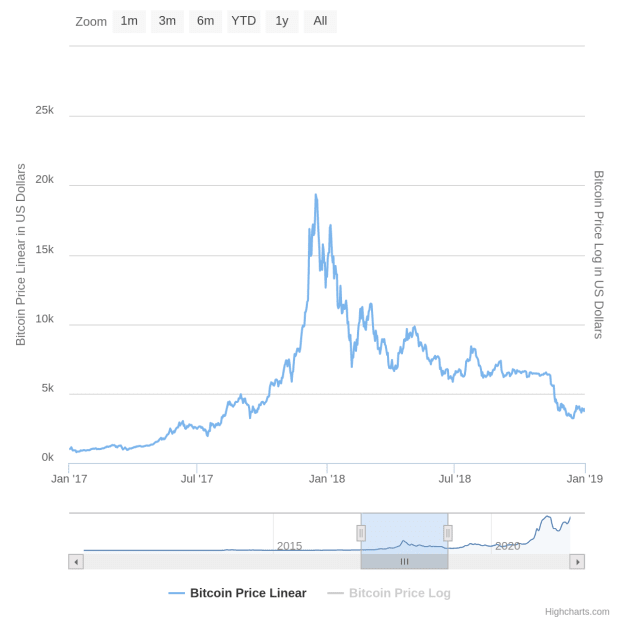
When viewed in relative terms these “bubbles” become comparable: price appreciation and correction, followed by consolidation at levels considerably higher than what was seen before the “bubble.”

And again, in 2021, we have the same story: a sllow build-up, dramatic rise, correction, consolidation, ultimately followed by further buildup and yet another all-time high.
This is why log-charts are useful. It lets you see all these “bubbles” on the same chart, but on a logarithmic scale, so that price cycles which differ by orders of magnitude can be compared side by side.
Relatively speaking, the 2011, 2013, 2017 and Apr 2021 “bubbles” all follow a similar trend:
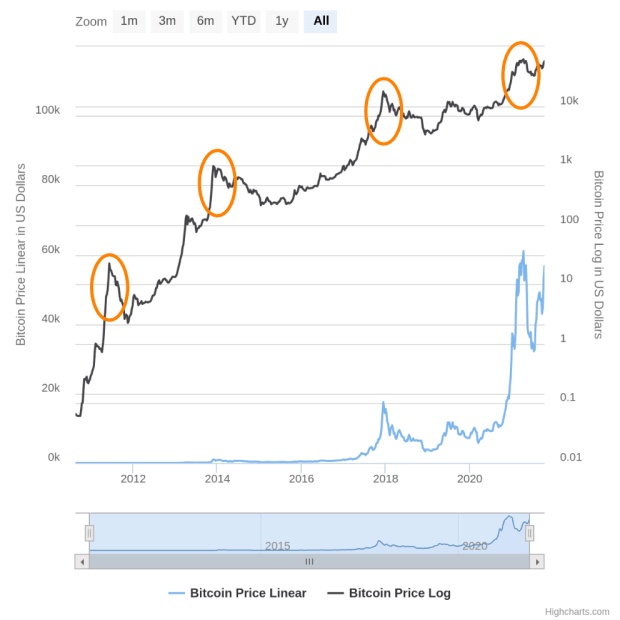
The blue line charts the price in linear terms, with it’s scale on the left, moving up in intervals of $20,000. While the black line charts the price on a logarithmic scale with it’s scale on the right, moving up in multiples of 10X, starting with $0.01, then $0.10; $1; $10; $100; $1,000 and $10,000, with the orange circles highlighting the “bubbles.”
It seems clear that there’s a steady upward trend and that the price could be heading towards a plateau of sorts. Plus, the volatile cycles for which bitcoin has become so infamous for, are becoming less so.
I just don’t see how anyone can confuse the bitcoin price chart with any of the other charts above. And I’d welcome any effort to disprove this perspective. But I suspect that, even based purely on its price charts and ignoring all of its other paradigm-shifting fundamentals, bitcoin looks unlike any other bubble in history, no matter what chart you look at.
And if you’re suspicious precisely because the price appreciation has been unlike anything else before it, if you’re thinking that because of this, if it’s not a bubble, it must be some sort of Ponzi scheme, then there’s a multitude of excellent articles that illustrates why this is not the case.
“As the number of users grows, the value per coin increases. It has the potential for a positive feedback loop; as users increase, the value goes up, which could attract more users to take advantage of the increasing value.” – Satoshi Nakamoto
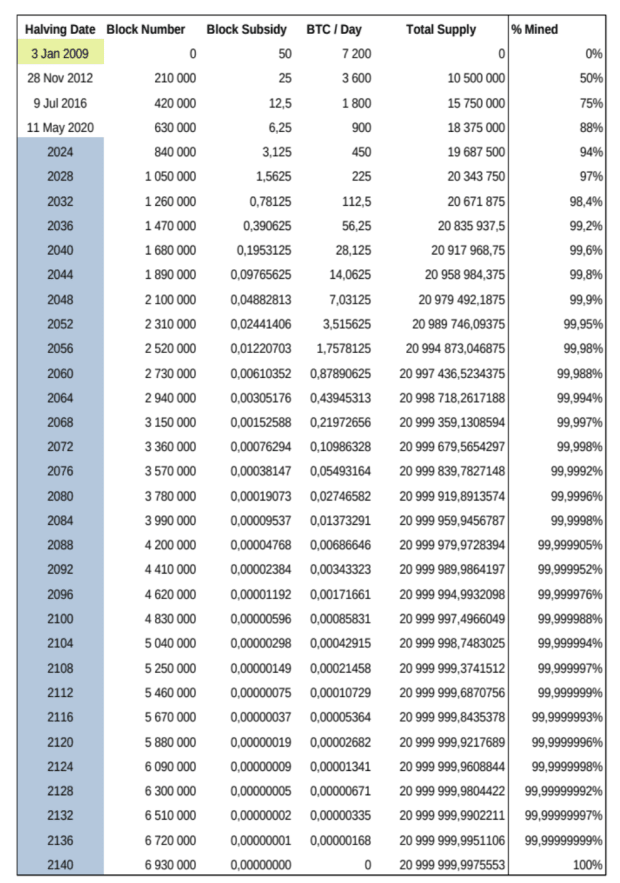
Suffice it to say that there are solid explanations for this highly unusual price appreciation, the most common being the observation that price cycles have been largely driven by halving cycles, which is a pre-programmed diminishing supply schedule hard coded into the Bitcoin protocol.
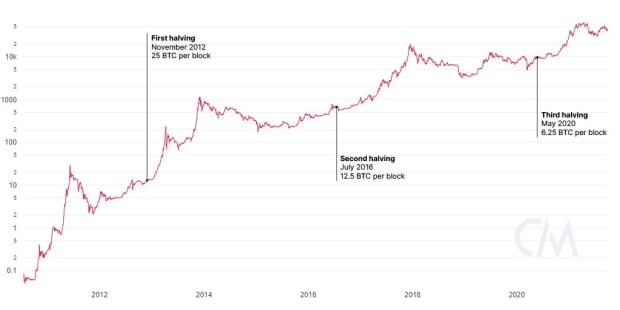
With each successive halving (every 210,000 blocks, occurring approximately every four years apart) stable demand begins driving up the price. This rise in price attracts more people, creating more demand, driving the price up even further, until it’s again temporarily overbought and must correct.
However, by the time it corrects, enough new people have learned about the fundamentals of the network and its underlying mechanics, which is 100% transparent for those who care to look. These people become hodlers and they weather the storm, so to speak. Because ultimately the value of the network is not strictly defined by the asset’s fluctuating spot price, but instead by the problems it solves.
Thus a price floor is formed that is higher than the previous one, based around the fact that each successive wave leaves behind more educated users than those who panicked and were swept out to sea. Thus the stage is set for the next cycle to begin anew, when the halving occurs and stable demand begins driving up prices yet again.
There’s no denying it: In most cases it’s self interest and profit (or least wealth preservation) that initially attract people to Bitcoin. But those who stay, do so to learn about the technology.
Because at the end of the day, if you stay long enough, you’ll learn that the dollar value of bitcoin pales in comparison to its value as the world’s first working implementation of a fully-distributed societal coordination and consensus mechanism.
And ultimately the price history reflects the steadily-spreading understanding that bitcoin is set to change the world’s power structures forever.
This is a guest post by Hermann Vivier. Opinions expressed are entirely their own and do not necessarily reflect those of BTC Inc or Bitcoin Magazine.


