Bitcoin Loves Weekends: Following an $800 Price Move, The 2019 High Is Closer Than Ever
In crypto like in crypto, things happen quick. Following the recent breakout after the 10-day consolidation period, Bitcoin had skyrocket $800 in less than two days.
In our recent analysis, we had stated that “Stochastic RSI had recently gone through a cross over in the oversold area, which could turn into a bullish move.”
Another thing to note is the bullish momentum during weekends. Like happened in May, June 2019 also proves that weekends are good times for Bitcoin.
As of writing this, Bitcoin marked $8800 resistance as the current high. The coin is now very close to its 2019 high around $9100 and in the case that the weekend momentum will continue, we will likely to see it been retested shortly.
Total Market Cap: $273 Billion
Bitcoin Market Cap: $154.4 Billion
BTC Dominance: 56.5%
Looking at the 1-day & 4-hour charts
– Support/Resistance:
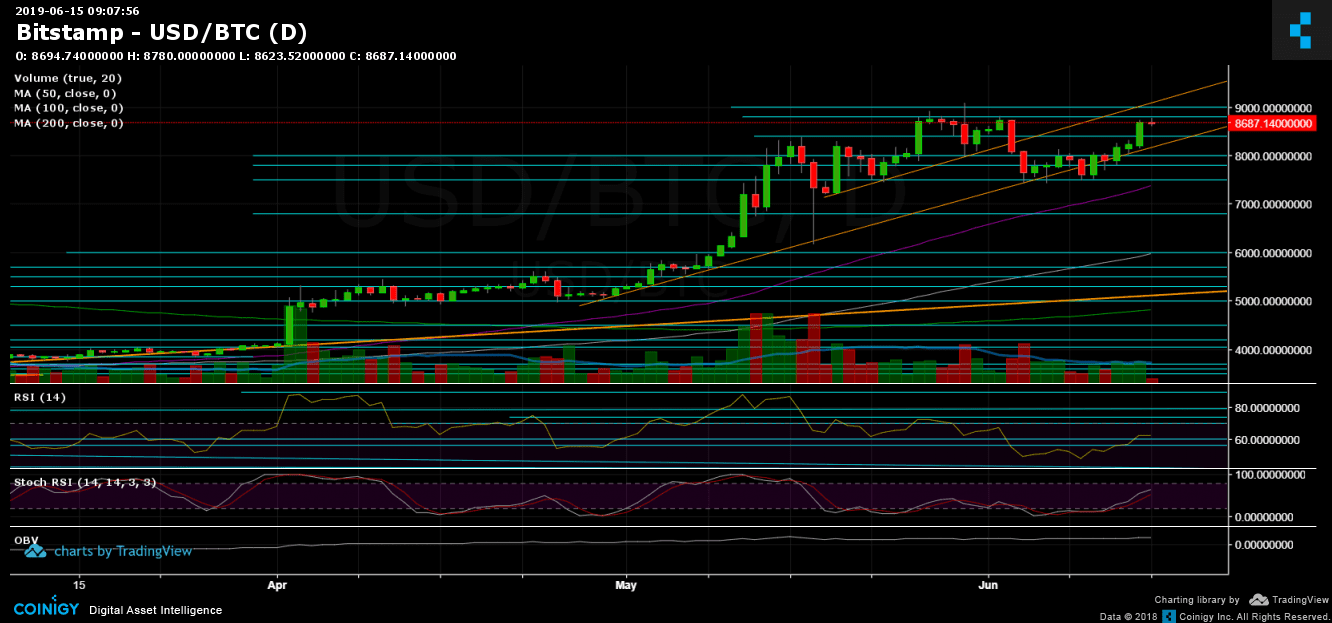
Following the bullish move, Bitcoin had broken up all the mentioned key resistance levels and is now facing $8800. Above the last, lies the 2019 year-high area at $9000 – $9100. Success in breaking up, and the way to $9600 and $10,000 will be very close.
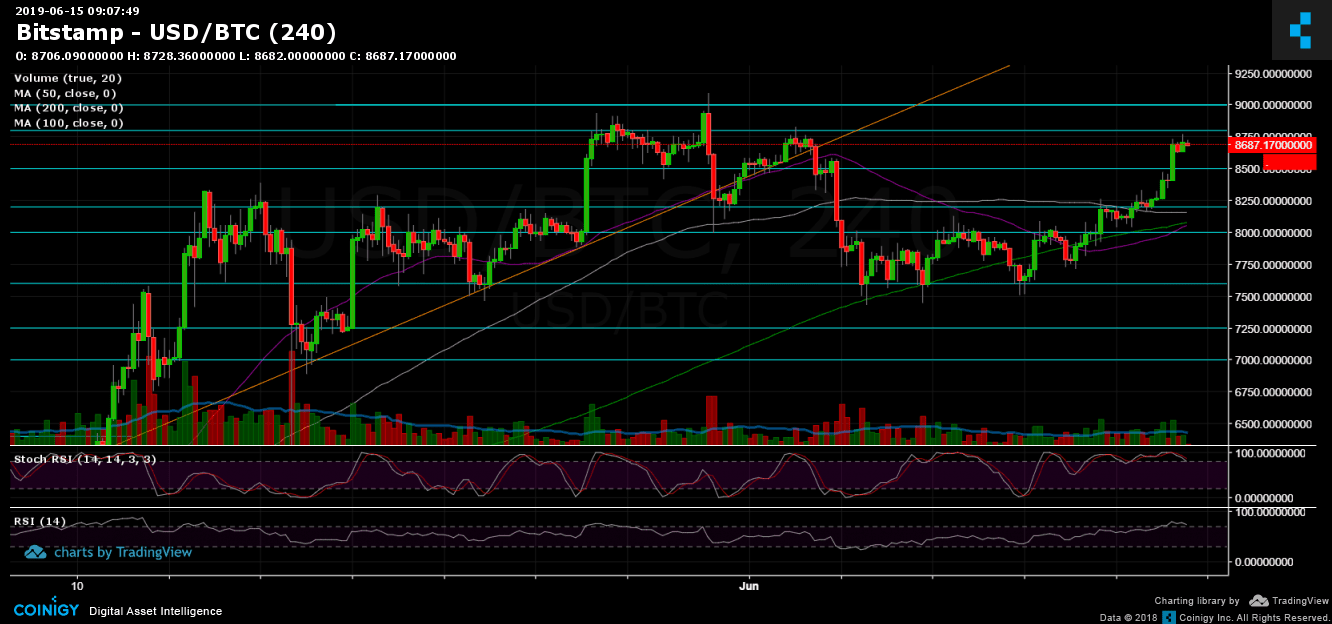
From the bearish side, Bitcoin’s support levels are the resistance turned support areas of $8500, $8400, $8200 – $8250 and $8100 (along with the 4-hour chart’s MA-200 and MA-50).
– Trading Volume: Yesterday’s rise had produced the highest volume candle of the past week, which shows strength. However, the volume isn’t significant as compared to the highest days of the previous 3-months.
– Daily chart’s RSI: On our recent analysis, we’d mentioned that there is “a space to go higher.”, by looking on the RSI. The indicator had broken above 56 and now lies in the bullish territory of 62. For the longer term, Stochastic RSI of the weekly chart had gone through a cross over down but hasn’t entered the bearish territory yet.
– BitFinex open short positions: Along with the rising Bitcoin, the short positions continue to rise: There are now 22.8 K BTC of open short positions, which is the highest level of the past 30 days.
BTC/USD BitStamp 4-Hour Chart
BTC/USD BitStamp 1-Day Chart
The post Bitcoin Loves Weekends: Following an $800 Price Move, The 2019 High Is Closer Than Ever appeared first on CryptoPotato.