Bitcoin Just Broke Down The Critical Support Line From 2015: What’s Next? BTC Daily Price Analysis
When Satoshi Nakamoto sat down to write the whitepaper of Bitcoin, he (or she) prepared precisely for today’s coronavirus situation.
The idea of Bitcoin was born after the latest devastating real-estate financial of 2008. All experts were eyeing this day. However, over the past weeks, Bitcoin is attaching its value to the global markets. This, instead of branding itself as a real safe-haven asset.
Yesterday, following President Trump announcement, including halting the flights to Europe for a whole month, Wall Street futures immediately plummet in response to the new financial impacts following to such fatal decision.
Not surprisingly, Bitcoin continues its correlation and made a rapid $400 price decline to retest the $7600 long-term support, which was discussed here yesterday.
Altcoins Suffer Even More
As of writing these lines, the $7600 level, along with the ascending trend-line from 2015, is broken. Since then, Bitcoin quickly dropped another $300, and now $7300 is the current daily low (it can be changed as you’re reading these lines). A weekly close below the long-term line, or $7600, will likely worsen Bitcoin’s situation.
The crypto panic expands to the altcoins, whereas the Bitcoin dominance index surged to 65.6%. Ethereum (ETH) seeing almost 15% daily price decline, as of now. Tezos (XTZ) and Chainlink (LINK) are both down approximately 20% on the daily.
Total Market Cap: $205 billion
Bitcoin Market Cap: $134.9 billion
BTC Dominance Index: 65.6%
*Data by CoinGecko
Key Levels To Watch & Next Possible Targets
– Support/Resistance levels: Bitcoin is struggling to stay above the $7300, which is the initial support from below. In case of a breakdown, then the next support lies at $7230, which is the Golden Fibonacci retracement level following the June 2019 bull-run.
Below lies $7000, $6800 (the 2020 low), and the $6400 -$6500, which is also the lowest price of Bitcoin since May 2019.
All indicators are in the oversold territory, so we might see a correction to retest and confirm $7600 as a resistance level. Further above lies $7700 and $7900. In the short-term, the situation looks very bearish but just as in crypto things can change quickly.
– The RSI Indicator: The RSI is back inside the descending wedge pattern. The momentum indicator recently marked its lowest value since November 2019.
The Stochastic RSI oscillator is about to make a crossover in the oversold territory. This might lead to some correction.
– Trading volume: The sellers are definitely here. Over the past days, the cumulative volume is massive.
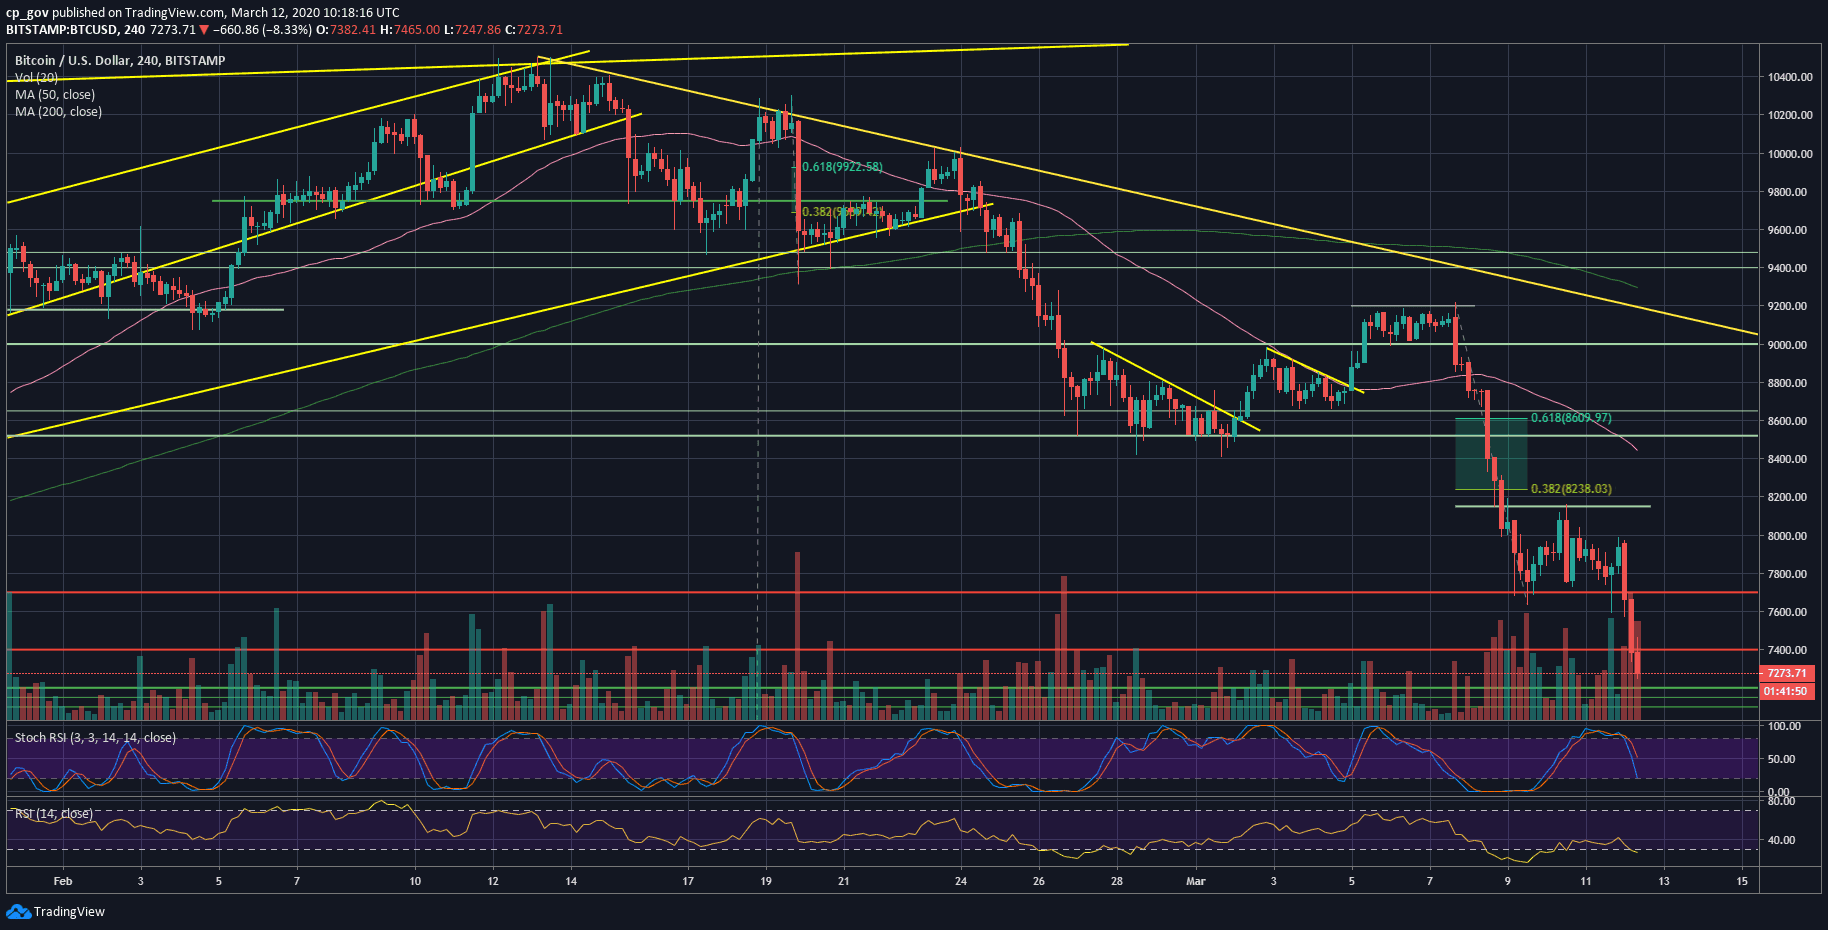
BTC/USD BitStamp 4-Hour Chart
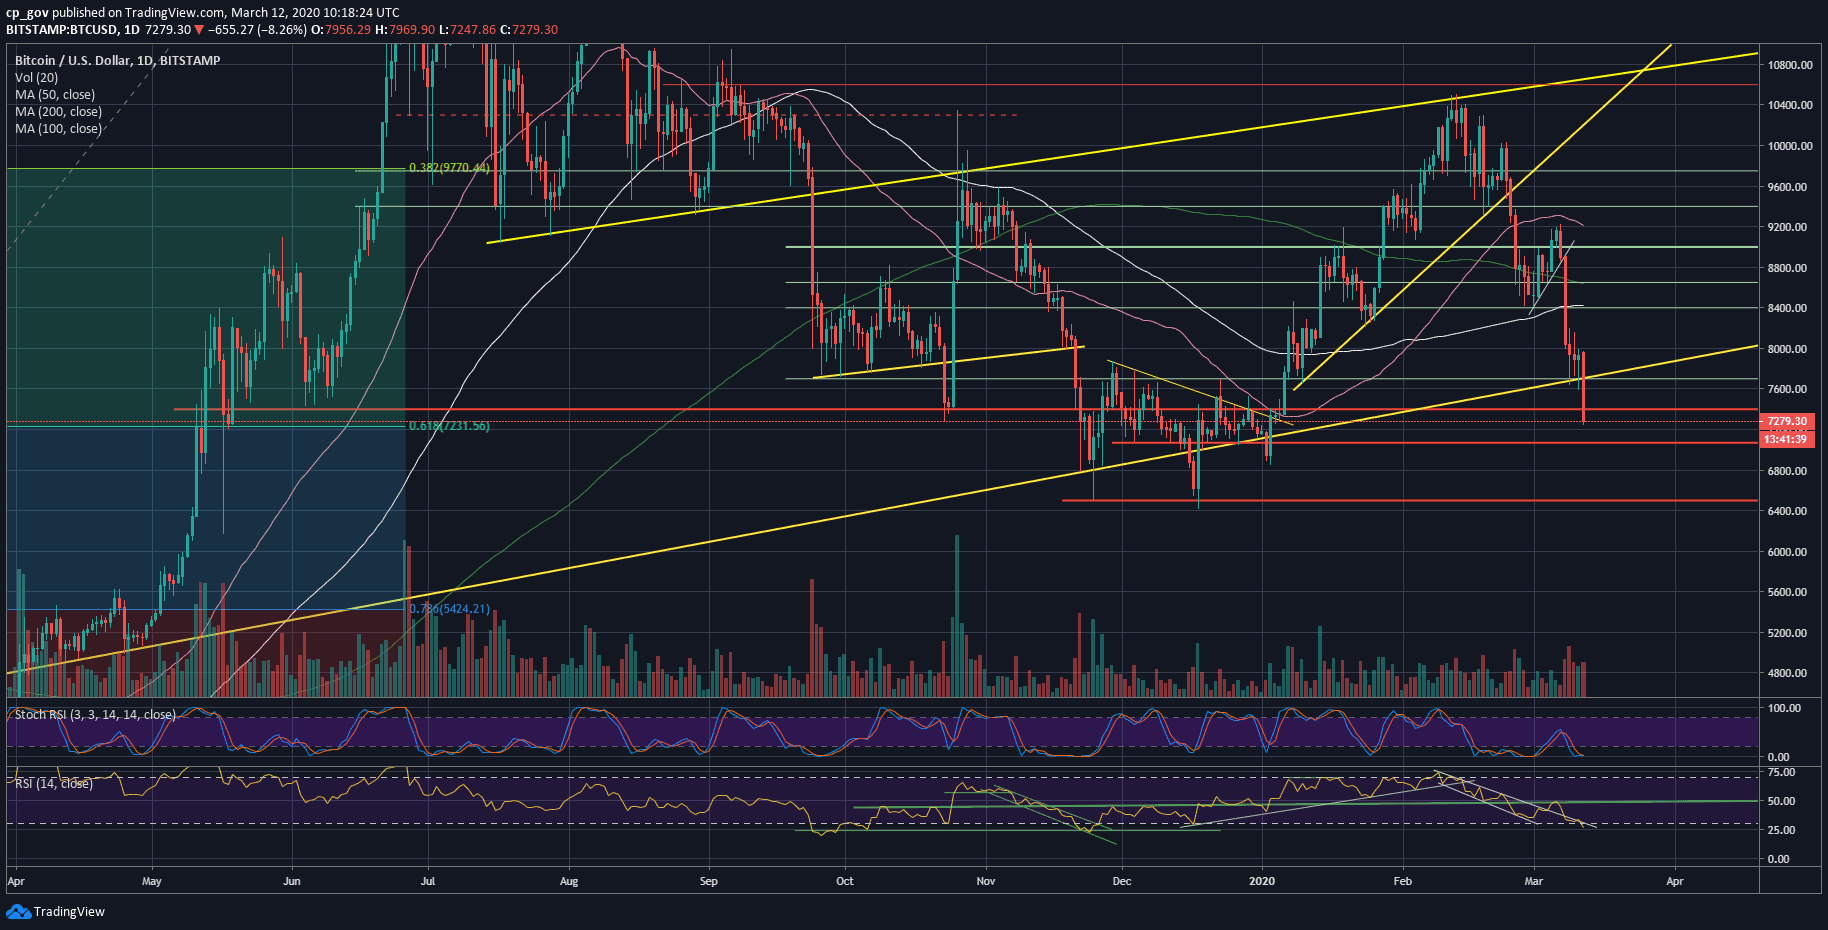
BTC/USD BitStamp 1-Day Chart
The post Bitcoin Just Broke Down The Critical Support Line From 2015: What’s Next? BTC Daily Price Analysis appeared first on CryptoPotato.