Bitcoin Is Struggling To Hold Its 200-Day MA
Despite the traditional stock market view on 200-day moving averages, a dip below it could mean a sale event for Bitcoin.
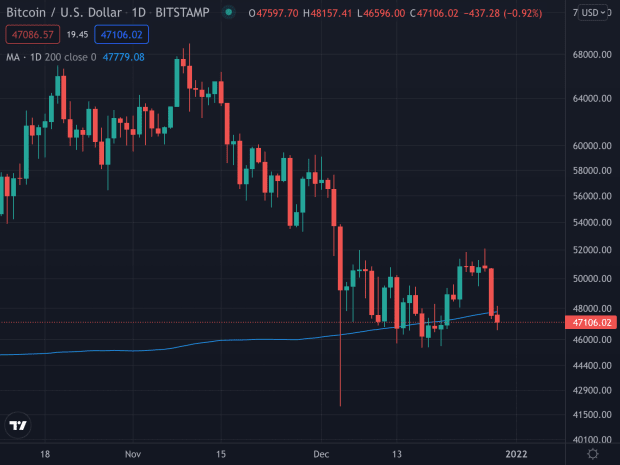
Bitcoin has been trading at sideways price action for most of December, struggling to stay above the 200-day moving average.
After a strong October and an early November of new all-time highs, Bitcoin has encountered a blocking road in December, having lost 13.60% since the beginning of the month. This reality stands in stark contrast to a widespread belief that Bitcoin’s price would hit $100,000 by the end of the year.
At the time of writing, Bitcoin is trading at around $47,500 after having closed below its 200-day moving average on Tuesday. The 200-day MA is often used to gauge an asset’s long-term trend in traditional capital markets. An asset is generally considered to be in an overall uptrend for as long as it holds above its 200-day MA.

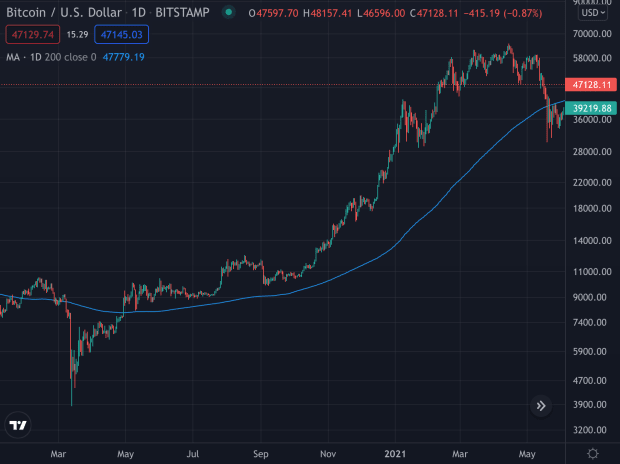
In March 2020, Bitcoin violently broke below its 200-day MA as the pandemic outbreak spread fear throughout the world, including capital markets. It took BTC about two months to get back above the moving average, triggering a stellar bull market that would extend past the end of the year. Bitcoin held above its 200-day MA for over a year until China banned bitcoin mining, once again spreading fear to those unaware of Bitcoin’s actual functioning mechanics and triggering a short winter for price over the summer months.

Despite the traditional stock market view that an asset below its 200-day MA could be in a bear market, for Bitcoin, it could represent a sale event. Given the peer-to-peer (P2P) currency’s strong, unique fundamentals and its history of crushing all other assets over the past 10 years, a dip below a technical indicator can serve as a discount indication, especially given Bitcoin’s volatility, which makes it plunge and soar more rapidly than traditional assets.


