Bitcoin Is Forming an Ascending Triangle Targeting Even Higher – BTC Price Analysis April 7
Continuing to our Friday Bitcoin price analysis; Bitcoin seems strong building demand around the $5000 zone. However, as we know the crypto industry, everything can happen after returning from the weekend on Monday (tomorrow).
Yesterday, Bitcoin retested the $5200 level one more time and quickly got rejected. The big picture is that BTC is forming an ascending triangle. Breaking up the triangle at the $5200 $5300 resistance could lead BTC to a further target of $5600 – $5700. The last area is the 2018 long-term support level, which got broken on November 14, 2018, and will now be tested as storng resistance.
Total Market Cap: $180.1 Billion
Bitcoin Market Cap: $91 Billion
BTC Dominance: 50.5%
Looking at the 1-day & 4-hour charts
– Support/Resistance:
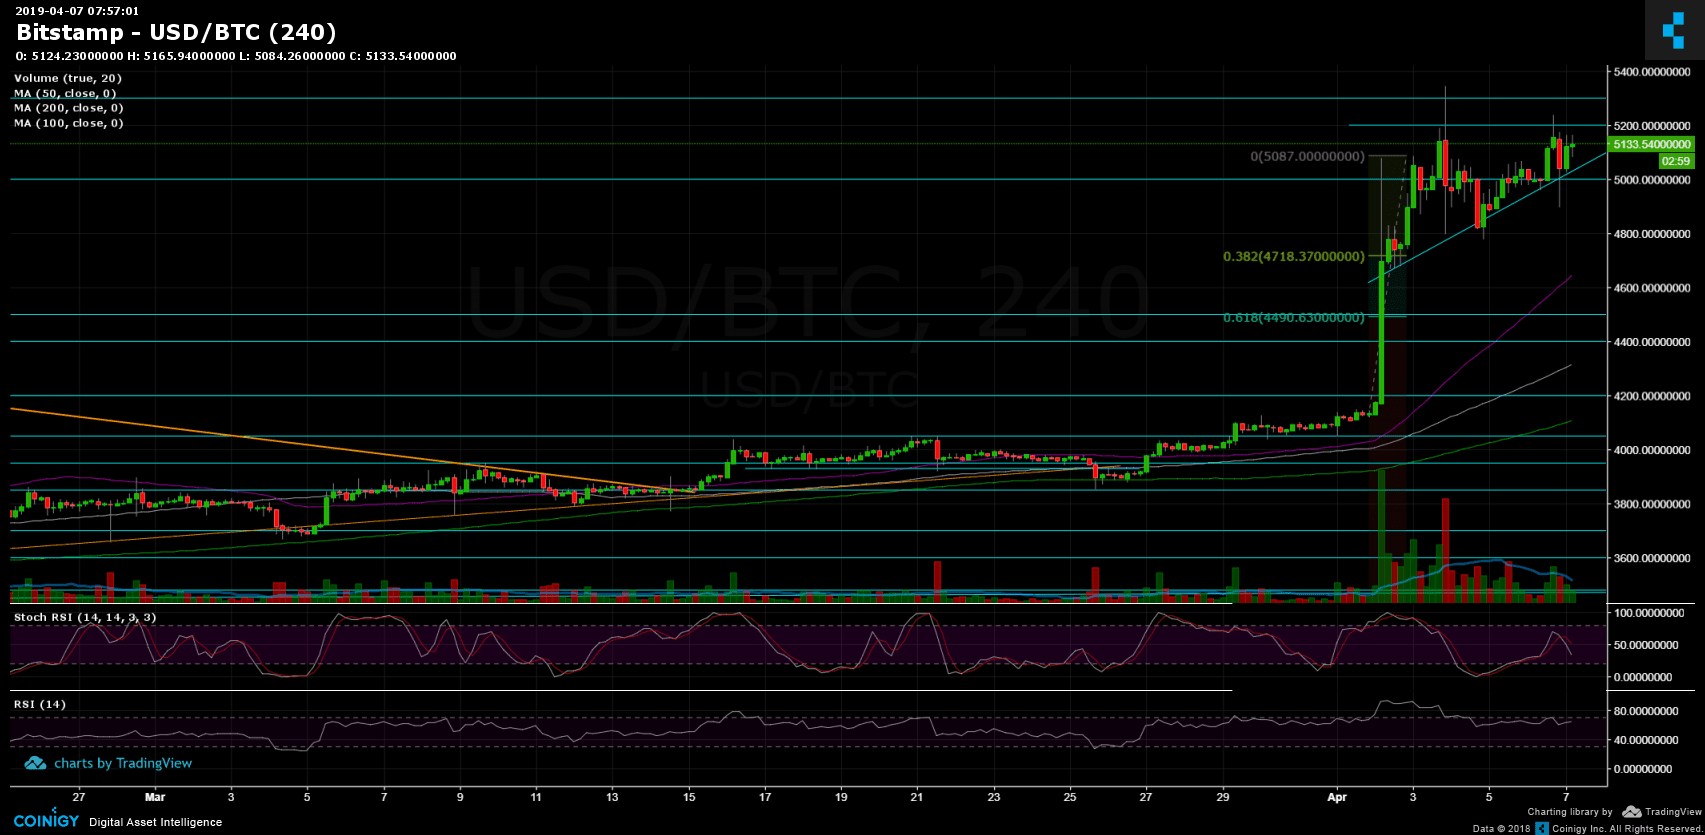
From above, Bitcoin is still facing the $5200 area. After twice getting rejected, Bitcoin is getting closer to breaking up the $5200; however, the real target is the resistance area of $5300. Above the last, resistance (weak) lies at $5500 before reaching the 2018 legendary support turned resistance line at $5700.
From below, the $5000 – $5100 is the nearest support level, along with the ascending trend-line of the mentioned triangle. Below lies $4800 and $4700. The next support level is the 200-days moving average line of the daily chart (marked in light green) which is around $4590 as of now.
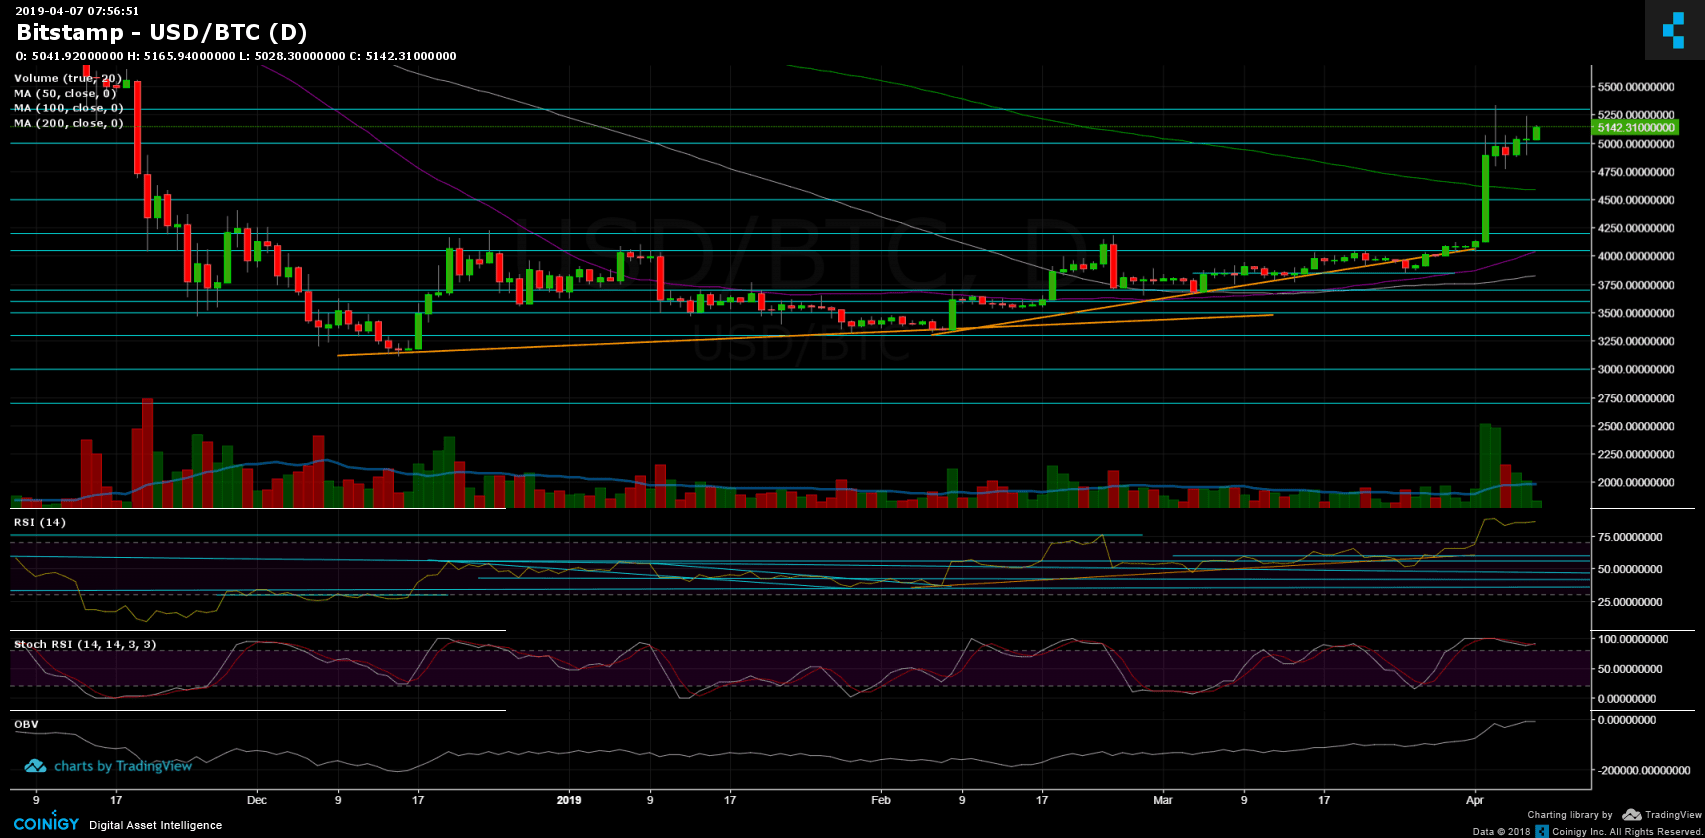
– Daily chart’s RSI: The RSI is level is nearing 90, deep in the bullish territory, which is the highest level throughout the past year. This could lead a reasonable correction down.
– The daily trading volume: Over the past week we can see a high volume of buyers. However, the past two days were dull in volume, probably due to the weekend.
– BitFinex open short positions: Since our previous price analysis, there was no significant change, whereas the open short positions lies at 21.1K of BTC open positions.
BTC/USD BitStamp 4-Hour Chart
BTC/USD BitStamp 1-Day Chart
The post Bitcoin Is Forming an Ascending Triangle Targeting Even Higher – BTC Price Analysis April 7 appeared first on CryptoPotato.