Bitcoin in Extreme Greed Levels Not Seen Since June 2019 Rally
Bitcoin has enjoyed the past several weeks with impressive price increases registering fresh yearly highs. As its price touched $16,000 hours ago, the community has become overly optimistic, according to a popular metric called the Fear & Greed index. However, history shows that similar scenarios could lead to steep price drops.
Extreme Greed Takes Over BTC
It’s safe to say that Bitcoin has entered a bull market after gaining over $5,000 in about a month. Apart from painting its highest price tag since January 2018, the primary cryptocurrency also significantly expanded its dominance over the alternative coins.
As it typically happens, the cryptocurrency community has followed and applauded BTC’s impressive price performance. Popular TV host Max Keiser predicted $28,000 per coin, while Digital Galaxy CEO Mike Novogratz said that Bitcoin has just entered its “big bull market.”
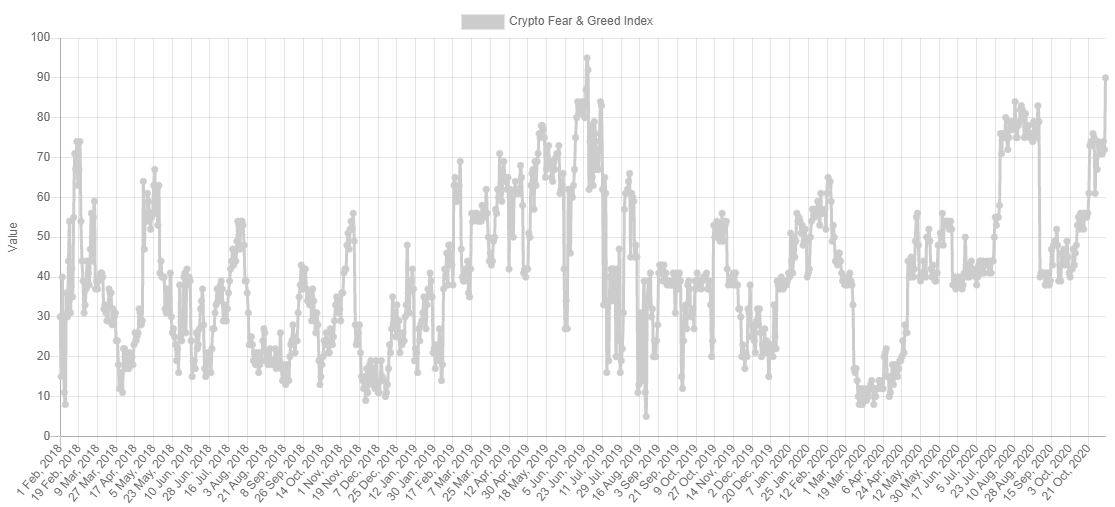
The Fear and Greed index also supports the positive narrative. The popular monitoring resource calculates various types of data, including volume, surveys, social media, and volatility, and provides the investors’ general sentiments towards the current Bitcoin market landscape.
The final result could range from 0 (extreme fear) to 100 (extreme greed). As the graph below demonstrates, the index is situated deep in the “extreme greed” field with a score of 90.
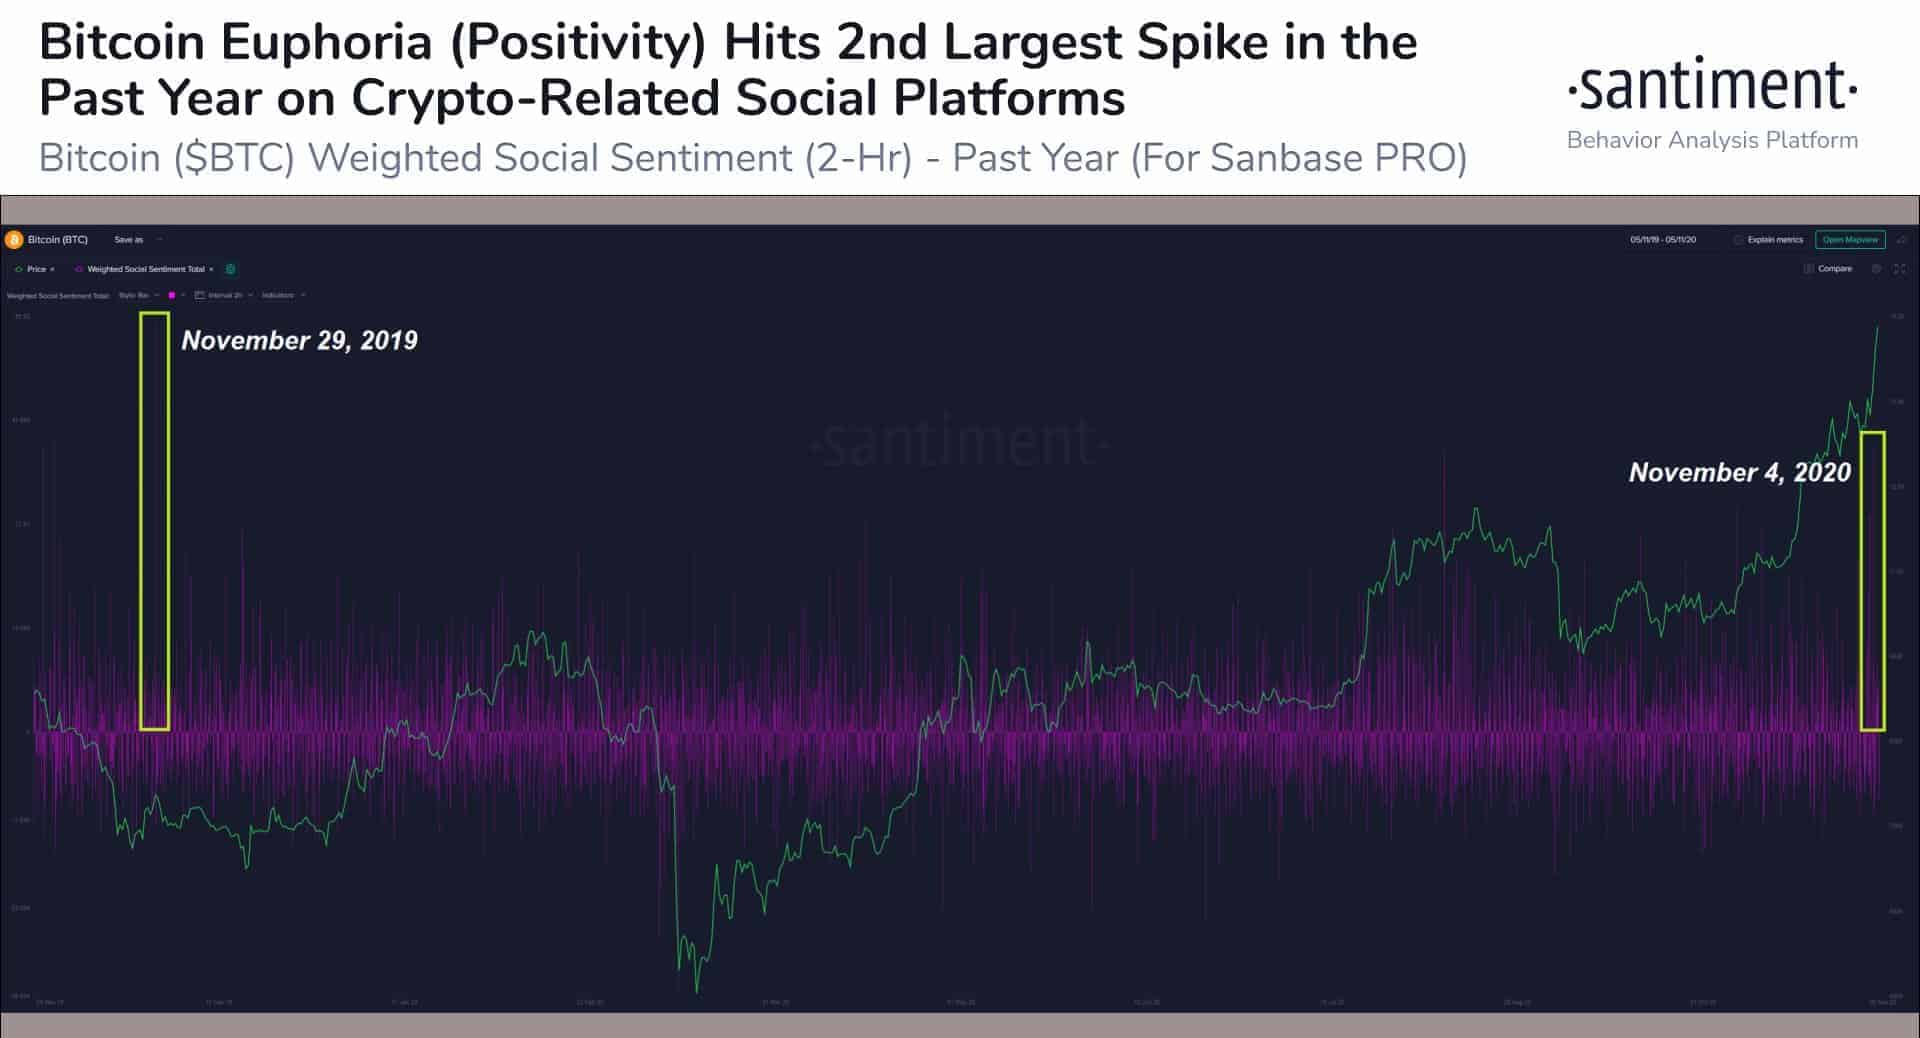
Additionally, the “Bitcoin euphoria (positivity) metric” from the analytics company Santiment indicates that the 2-hour weighted social sentiment candles recently reached a 12-month high as well. The company said that when BTC surged past $14,000 a few days ago, the general “sentiment on social platforms skyrocketed.”
Could Greed Be Bad?
Although Gordon Gekko preached in the 1987’s classic movie Wall Street that “greed is good, greed is right, greed works,” that may not be the case with the F&G index and the extremely positive sentiment, at least according to history.
The last time the index displayed such an “extreme greed” number of 90 or above was in June 2019. It came after another impressive leg up that resulted in BTC’s yearly high of $13,900.
However, what followed was completely the opposite of what the community expected. In the next few weeks, BTC failed to sustain its level and after a sharp nosedive dumped beneath $10,000.
As such, it’s worth noting that the F&G index is not an adequate price indicating. Just the opposite, it could signify a potential trend reversal.

