Bitcoin Has Broken Up The $4000 Mark. What’s The Next Target? BTC Price Analysis March.16
We had a breakout of the triangle! And… the direction was bullish: Maybe Bitcoin wanted to join the party and take part in the new Altcoin Season?
This is from our latest BTC price analysis: “Bitcoin is forming a symmetrical triangle. The apex is soon to be reached. Hence, we are expecting a move to either direction over the next day or two. As always in trading, both sides are considerable.”
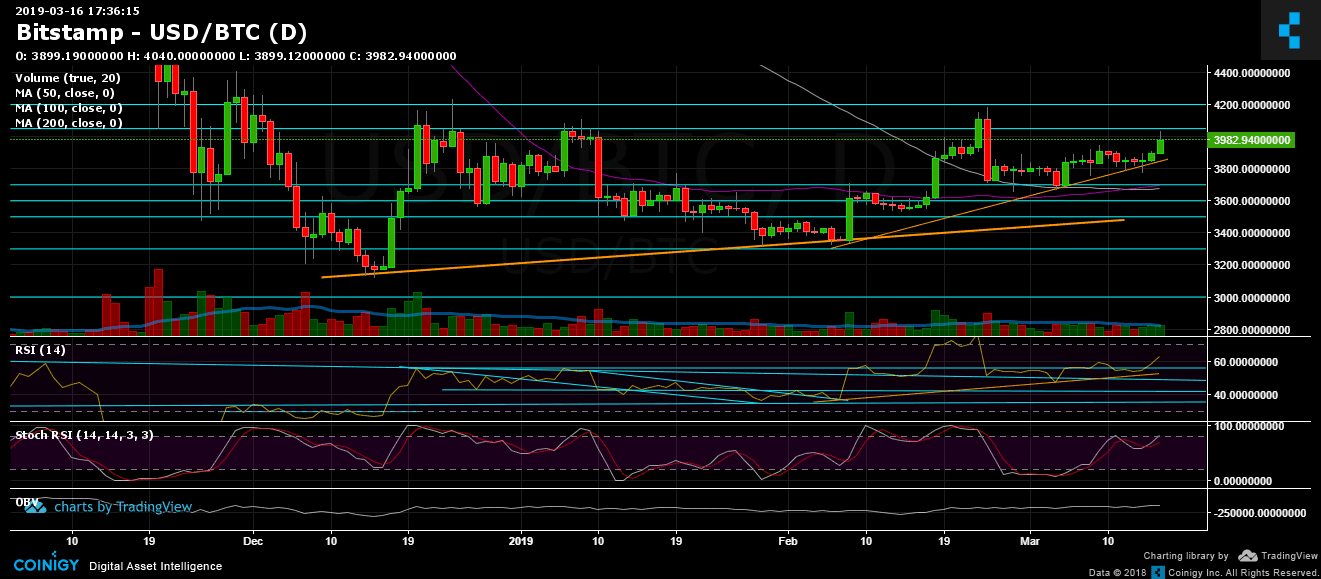
We’ve also talked about the mini Golden Cross, whereas the 50 days MA had crossed over the 100 days MA (on the daily chart). This cross had also contributed to deciding the direction of the breakout.
Total Market Cap: $140.3 Billion
BTC Dominance: 50.7%
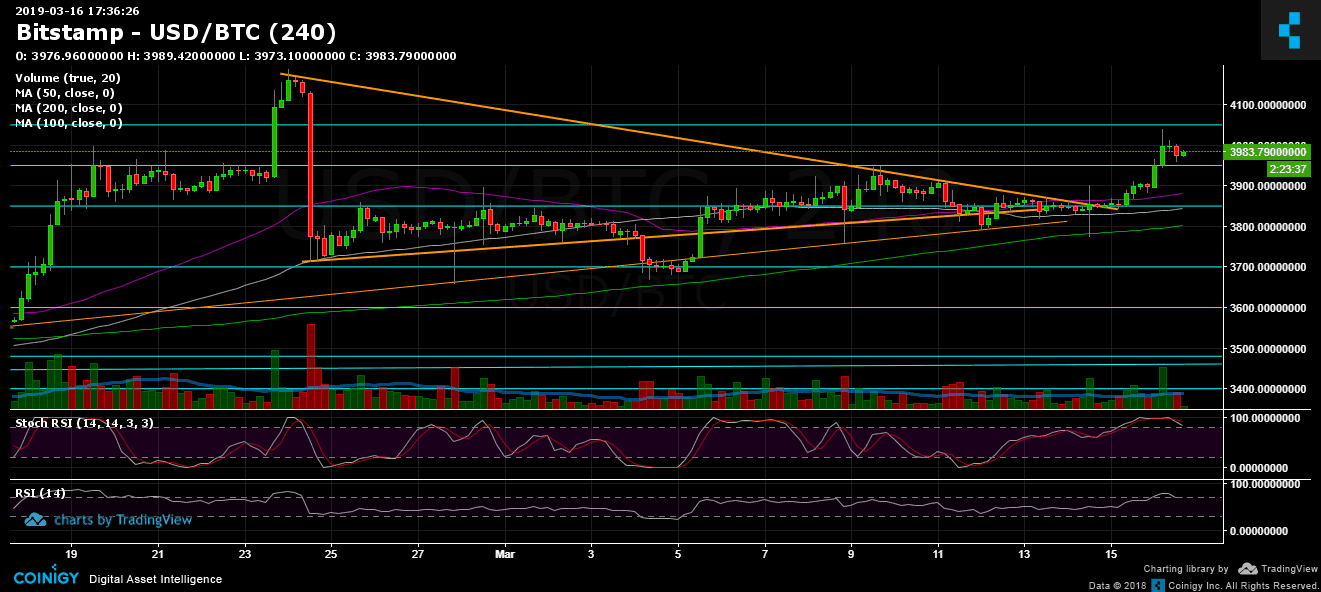
Looking at the 1-day & 4-hour charts
– Support/Resistance: As mentioned above, Bitcoin had fabulous gains over the past day, breaking up the resistance area of $3900 and $3950, reaching the significant mark of $4050 before getting rejected. As of now, the $3950 has been tested as a support level. From above: The next major level is the $4050, breaking up is likely to send BTC to retest the $4200 resistance.
From below, the closest support is the resistance-turned-support level at $3950, beneath are the $3900 and $3800 support levels, before reaching the $3670 – $3700 zone which includes the 50 and 100 days moving average lines (daily chart).
– The daily chart’s RSI level: After getting support by the ascending trend-line (marked in orange line), the RSI had finally broken up the 56 RSI mark. By looking at the 1-day RSI indicator, there is still room to move above.
– The daily trading volume: Despite the nice recent bullish move, the volume isn’t convincing yet. It might be because of the weekend.
– BitFinex open short positions: The short positions have increased to 22K BTC open positions.
BTC/USD BitStamp 4-Hour chart
BTC/USD BitStamp 1-Day chart
The post Bitcoin Has Broken Up The $4000 Mark. What’s The Next Target? BTC Price Analysis March.16 appeared first on CryptoPotato.