Bitcoin Goes Up – Altcoins Go Down; BTC Goes Down – Altcoins (Still) Go Down. Why?
The long-awaited altcoin season doesn’t seem to be anywhere near the horizon, as Bitcoin continues to dictate the entire market. Regardless of what direction the cryptocurrency takes, it appears that altcoins just can’t make it out of their slump.
Bitcoin Goes Up – Altcoins Go Down
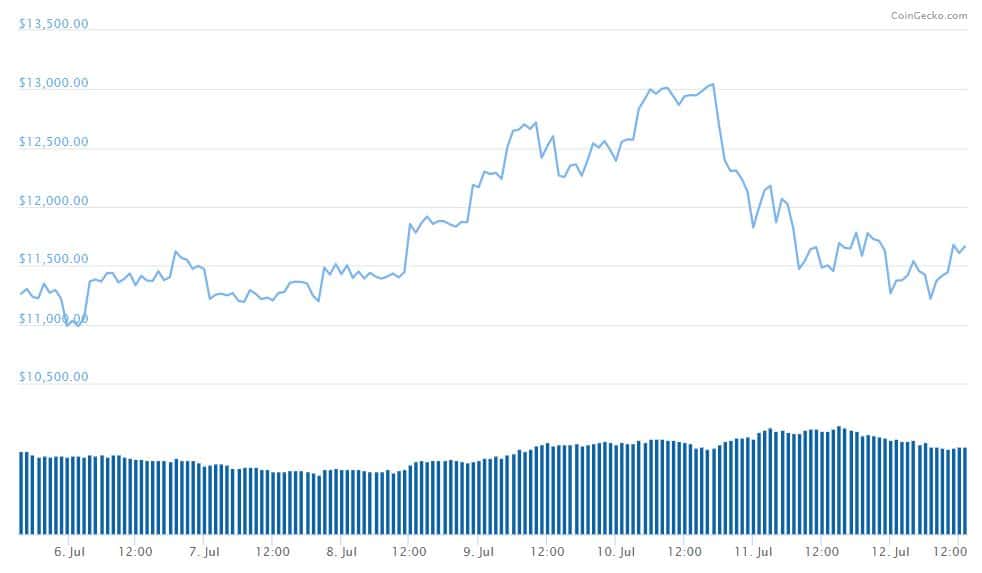
It’s safe to say that 2019 has so far been great for Bitcoin. Since January 1st, the cryptocurrency is up more than 210%, at the time of this writing. Looking at shorter-term graphs gives us pretty much the same picture.
In the past three months, Bitcoin surged from around $5,070 to its current price at $11,600, which represents an increase of more than 125%.
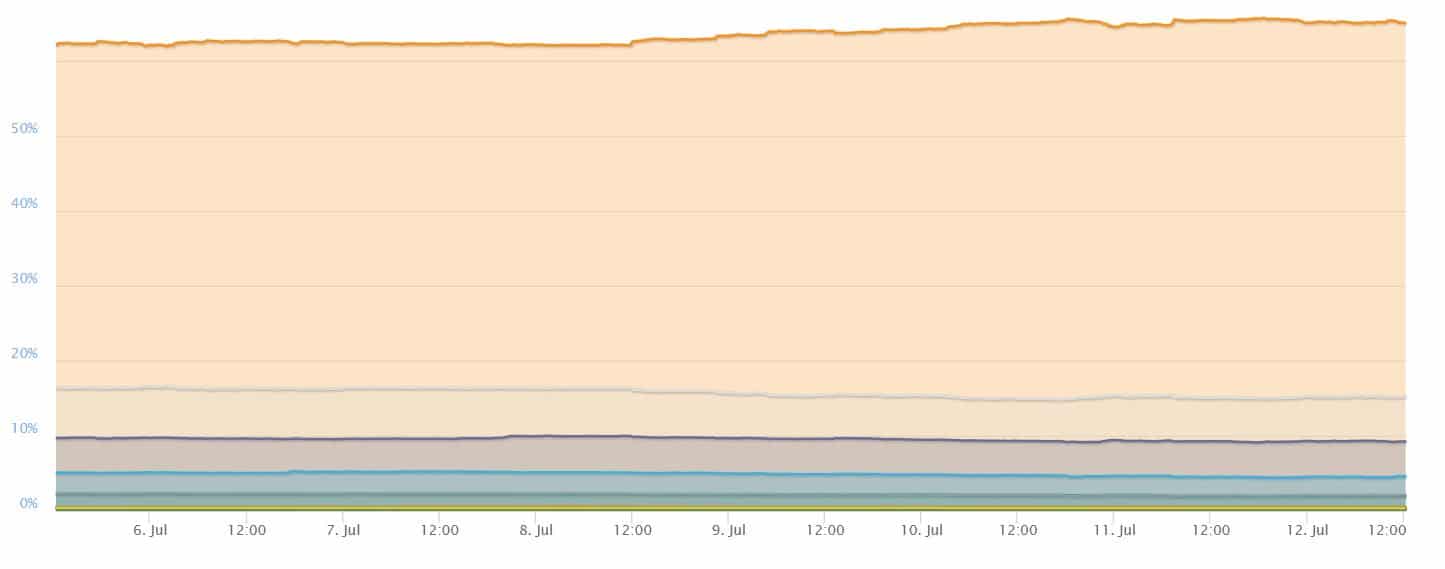
However, this has had a tremendous impact on the overall market dynamics as well. Bitcoin’s dominance index which tracks its relative share in the entire market also took off for the skies. Presently, BTC dominance stands at 65.1%, leaving altcoins hanging out in the dry.
Indeed, altcoins have been suffering, especially when trading against BTC. Ethereum (ETH), the second-largest cryptocurrency, has lost about 35% of its value against BTC since the beginning of the year. Things are looking even worse for Ripple (XRP), the value of which dropped with about 77% against BTC in 2019. The situation is more or less the same with other large-cap altcoins as well.
Smaller altcoins are also feeling the pain. WAVES, for instance, is down a whopping 85% against Bitcoin since January 1st.
Amid this Bitcoin-dominated market, many have hoped that a drop in the price of the largest cryptocurrency would allow altcoins to recover and potentially reclaim a higher percentage of the market. But it didn’t really turn out this way.
Bitcoin Goes Down – Altcoins Still Go Down
The last week has been nothing but tumultuous for Bitcoin. After surging to about $13,100, it went on to suffer a significant loss which brought its price back to about $11,600, marking a decline of more than 11%.
Yet, what many thought would help revive altcoins, turned out to be the exact opposite. Not only did altcoins continued to depreciate when trading against BTC, but they also took a serious cut in their price against the USD.
Looking at large-cap cryptocurrencies, we can see that ETH lost around 10% of its USD value. Ripple (XRP) lost about 18% of its value while Litecoin (LTC) lost about 16% before starting to recover.
In other words, it didn’t do the altcoins any good that Bitcoin dropped in value. What is worse, BTC dragged them with it and most of them actually lost more than BTC itself.
Altseason Postponed?
Indeed, it seems that it doesn’t really matter which direction Bitcoin will take right now. The fact that it lost almost $2,000 off its value didn’t seem to cause its dominance to drop, as it remained almost unchanged.
As Cryptopotato reported a few days ago, analysts seem to believe that the next Altcoin season won’t be until 2020. We have yet to see whether or not this will be the case but up until this moment, it’s definitely nowhere to be seen.
Perhaps among the reasons for which Bitcoin is currently dominating the market is because it has an actual use case. Moreover, the same was validated by the Chairman of the US Federal Reserve, Jerome Powell, who said that “bitcoin is a store of value… like gold.” Apart from that, altcoins are historically bleeding in terms of value, which is another potential reason for their current situation.
The post Bitcoin Goes Up – Altcoins Go Down; BTC Goes Down – Altcoins (Still) Go Down. Why? appeared first on CryptoPotato.