Bitcoin Flashes Largest Technical Buy Signal Since April 2020 – More Upside Ahead? (BTC Price Analysis)
After a weekend with wild swings and liquidations, BTC bulls managed to push the price higher, making the first weekly close above the 21-week and 200-day moving average. Technical analysts consider this a major buy signal, as it has led to significant rallies for bitcoin.
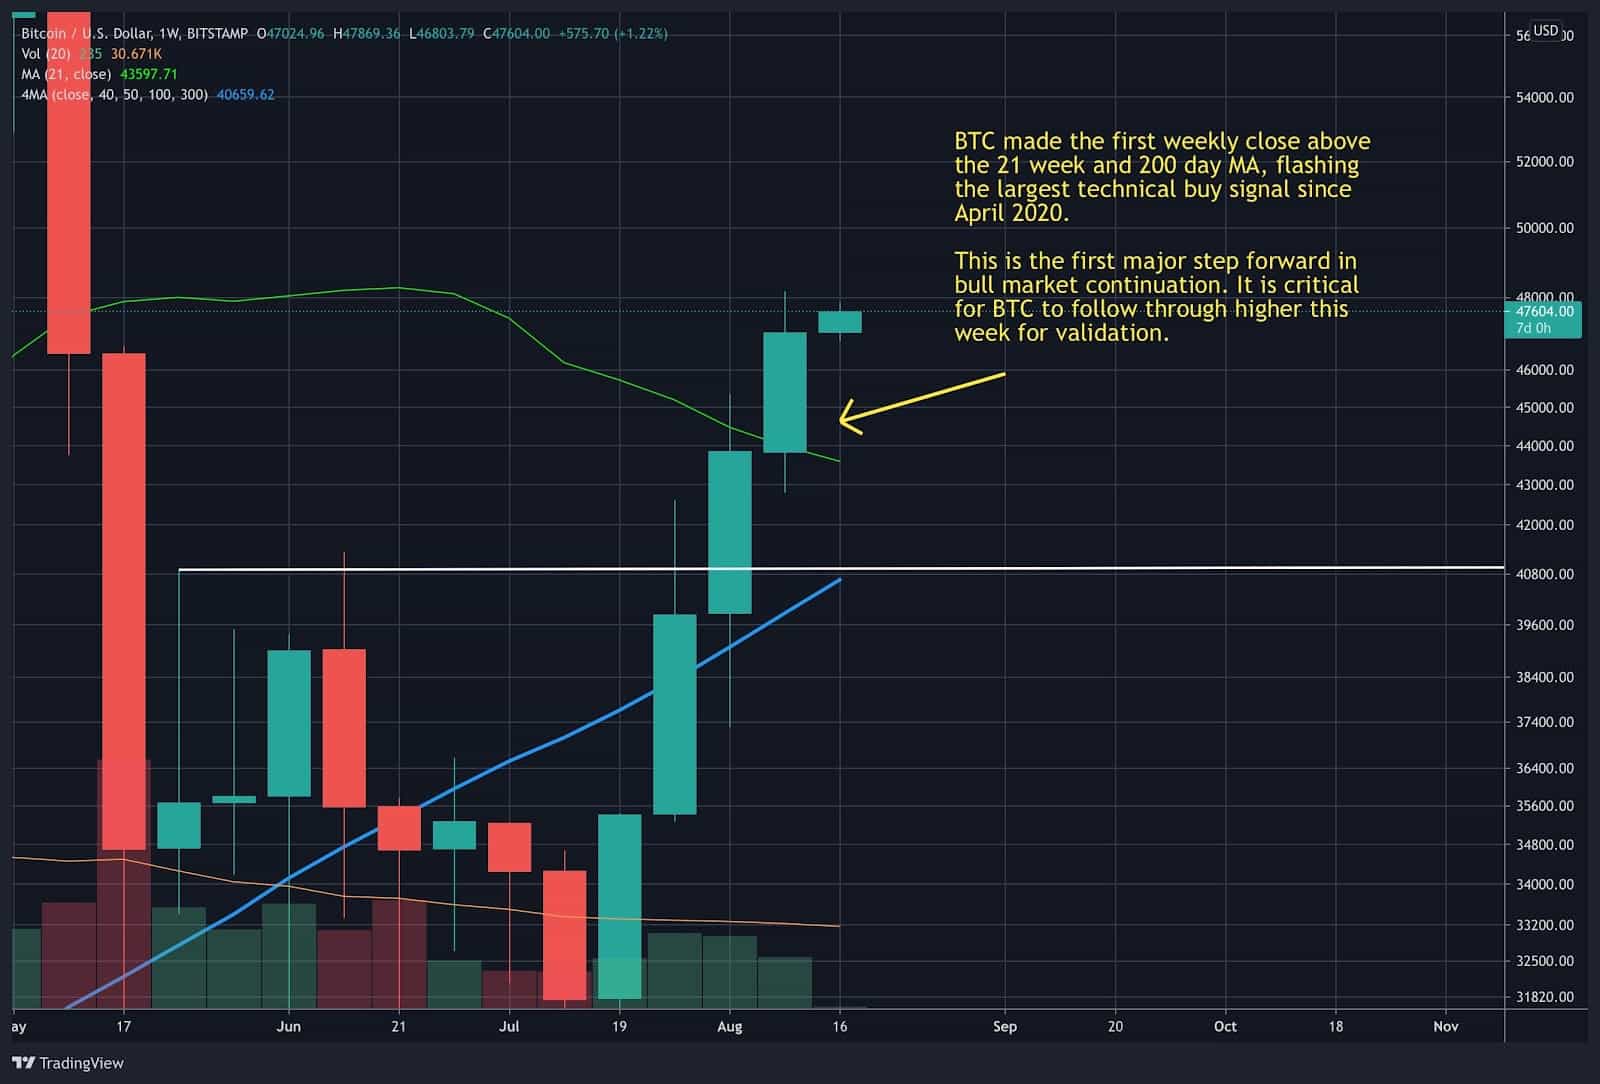
The last time this occurred was April 2020, right after the March COVID-19 crash that sent all risk assets plummeting. After reclaiming the 21-week and 200-day moving average, BTC rallied over 600% before topping out near $64.8k.
What Has Changed for Bitcoin’s Price?
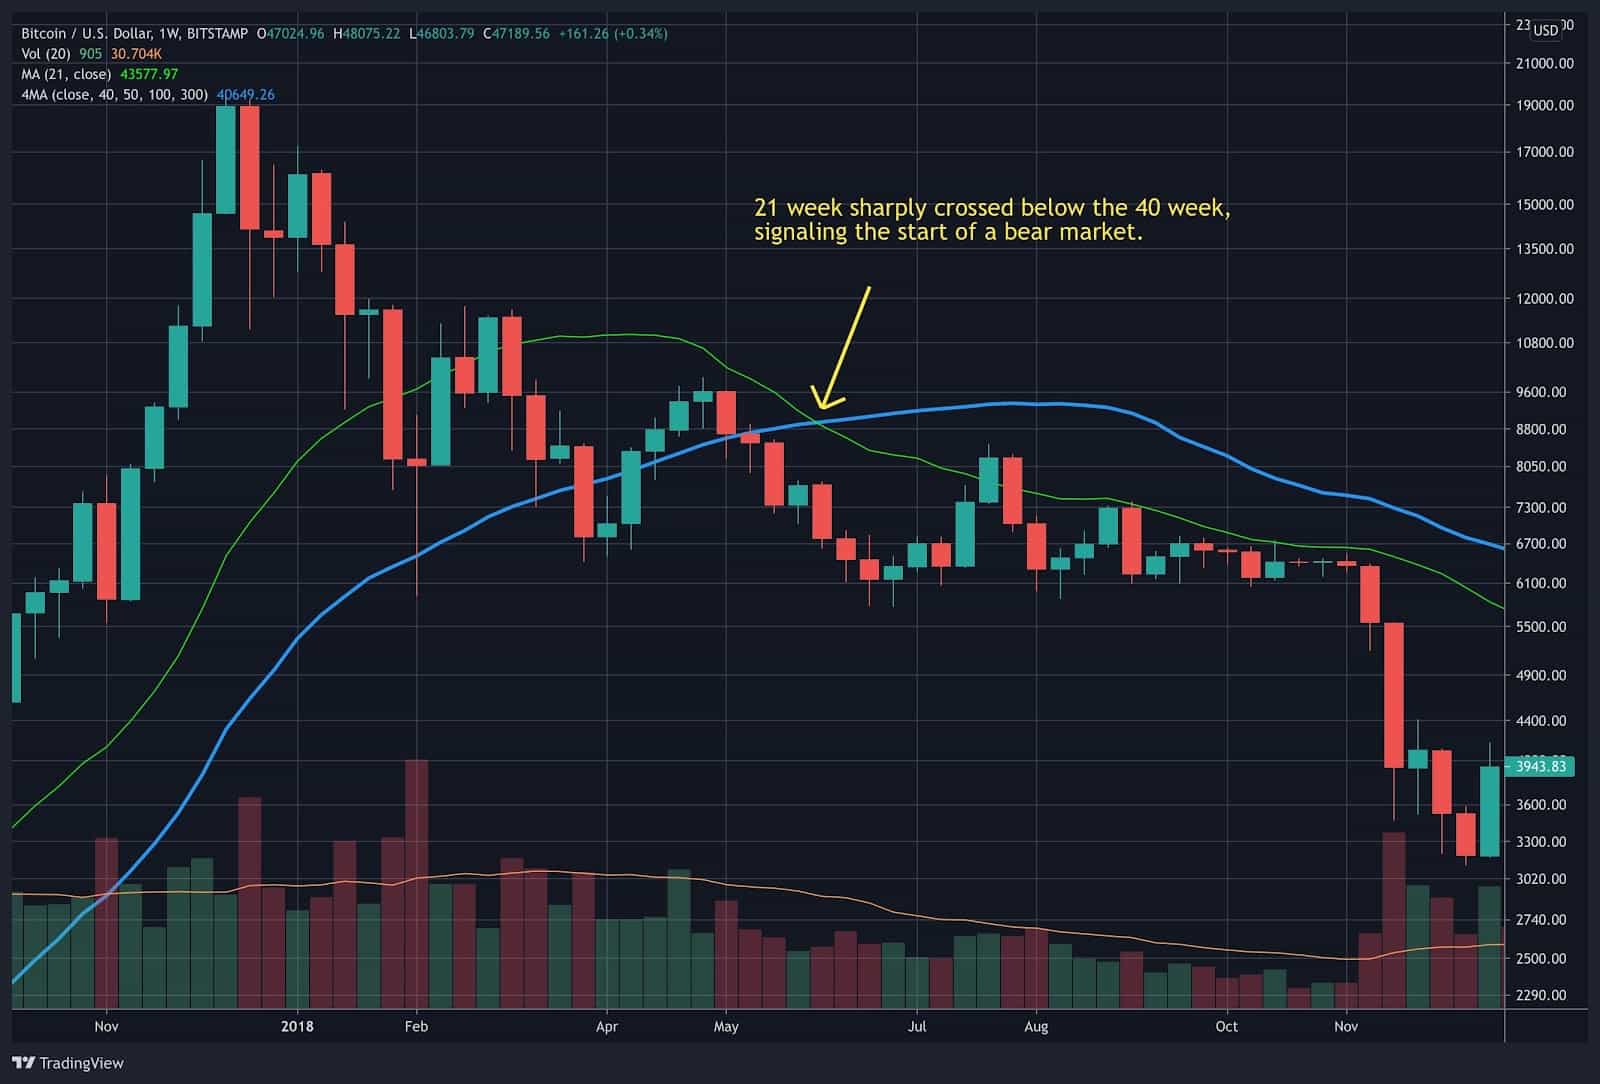
Back in June, BTC reached a critical point on the weekly chart after closing below the 21-week and 40-week moving average. Historically, failure to reclaim these levels has led to the start of bear markets. This is known as the 21/40 Rule, a way to help identify long-term uptrends and downtrends.
Market sentiment turned extremely bearish as the Fear and Greed Index spent nearly 3 months at extreme lows. The multi-month consolidation between $30k to $40k caused the 21-week to trend lower, a warning signal on the weekly chart. On July 19th, BTC formed a false breakdown below $30k and started a 4-week long, 65% rally off the lows to reclaim the 21-week, 40-week, and 200-day moving average.
This impressive rally, driven by deep supply exhaustion, short liquidations, and consistent spot buying has helped slow the decline of the 21-week moving average, potentially helping BTC avoid the bearish cross of the 21-week and 40-week moving average.
Largest Technical Buy Signal Flashes, Now What?
With the largest technical buy signal flashing for the first time since April 2020, BTC bulls have many reasons to celebrate the potential re-entry into bull market continuation. Regardless, BTC still has a lot of work to do in proving it can follow through higher to validate the signal.
For example, the 2018 BTC bear market saw a strong rally above the 200-day moving average, but BTC struggled to follow through and ended up falling back below this key level, going significantly lower. This is why it is critical for the cryptocurrency to follow through to the upside this week to validate the uptrend.
The next few weeks will also be critical for BTC’s bull market continuation. There have also been cases where BTC reclaims the 200-day moving average, but then price pushed sideways for months, which then led to the 21-week crossing below the 40-week, leading to a bear market. This is something all investors must consider, given there is no certainty in markets.
Ideally, the bulls need to push BTC higher, especially above $50k as there is a moderate amount of realized price distribution and volume traded in the upper $40k to $50k. If BTC can close back above $50k, the next major target of interest is $51.1k to $57.1k, an area with even higher realized price distribution, and volume traded.
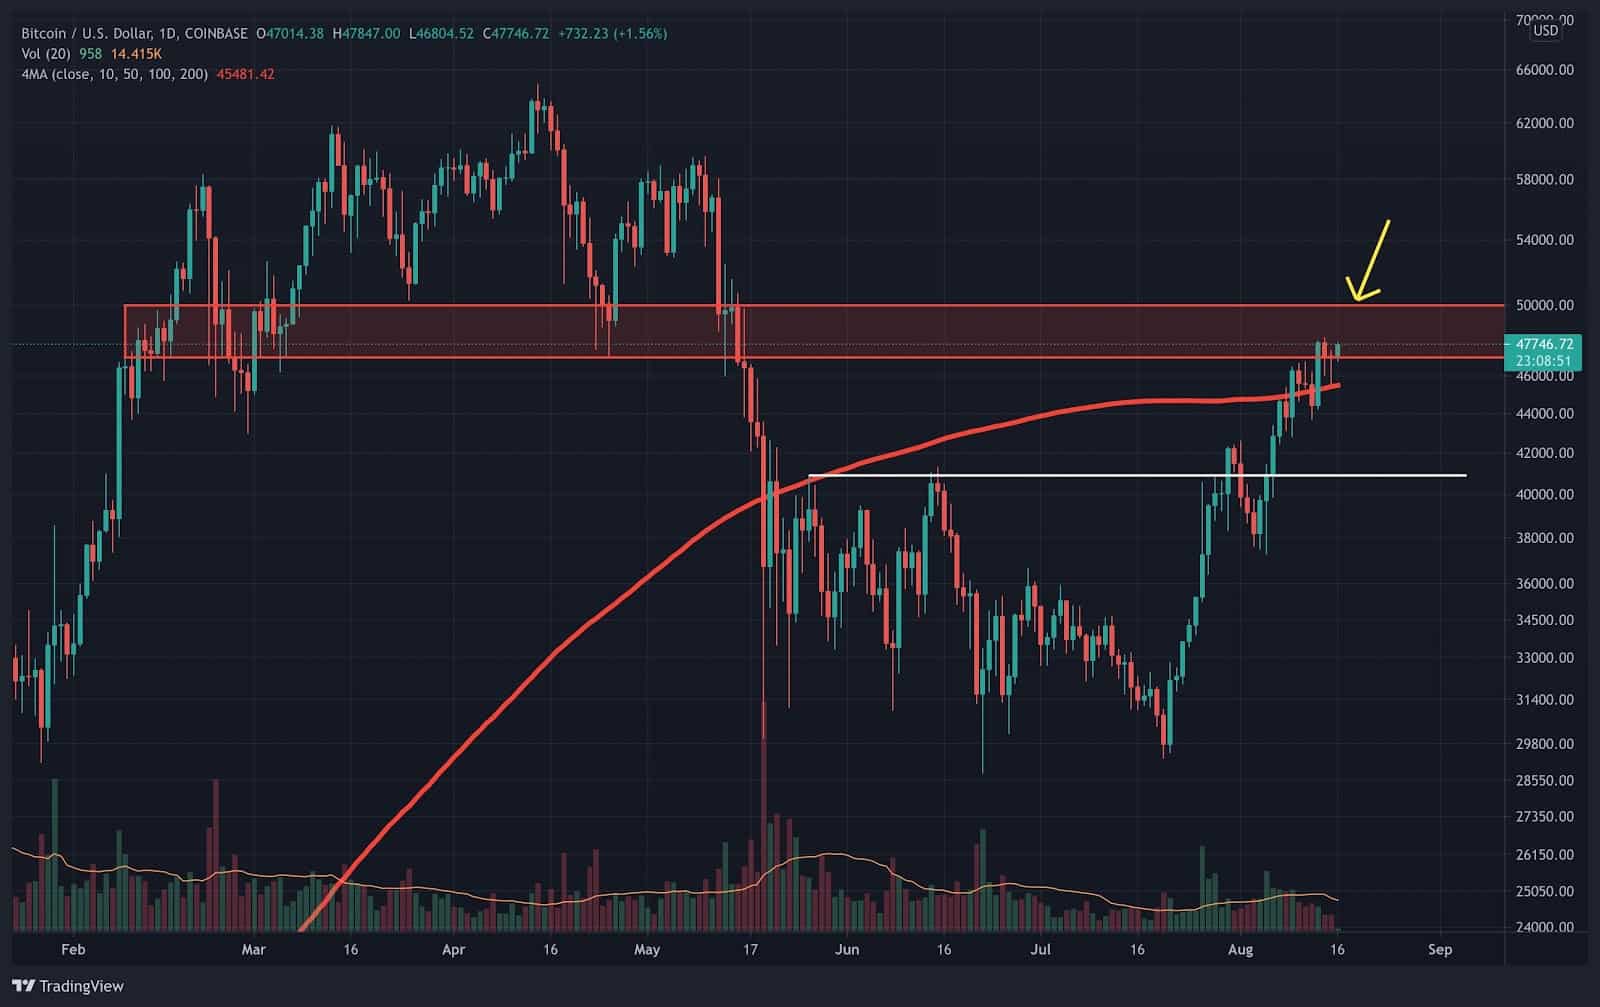
If these important zones are tested as resistance, it is important to monitor on-chain metrics to make sure long-term holders and large entities holding illiquid supply continue doing so. Additionally, we need to see enough buyers coming in to absorb potential incoming supply as previous buyers from February to April could be looking to sell to break even or realize small gains.
Bitcoin Metrics Improving Across the Board
Overall, BTC fundamentals, technicals, momentum, on-chain data, and sentiment have all significantly improved and are showing strength. From the Hash Ribbon flashing a long-term buy signal, record network user growth, miners accumulating for months, increasing illiquid supply, exchange reserves at multi-year lows, and strong accumulation across multiple cohorts, there is a wide variety of data suggesting a bullish outlook for the largest cryptocurrency.
Looking at the structure, BTC is looking to complete Phase D in Wyckoff Accumulation especially after breaking out of the $30k to $40k trading range. BTC has followed Effort/Result and Supply/Demand principles which eventually lead to supply exhaustion as the weak hands capitulate. On-chain data has also verified this as the majority of selling during consolidation came from short-term holders, the cohort who bought between $50k to $64k.

The BTC bulls pulled an impressive win with the weekly close and now must push higher for validation of the buy signal.


