Bitcoin Fights For $10,000: Is The Sell-Off Over? Updated BTC Price Analysis
Just four days ago, one Bitcoin was trading for over $12,000. However, the cryptocurrency markets followed the global markets, and as of writing these lines Bitcoin fights to close the daily candle above $10,000.
If the bad blood coming from the equity markets was not enough, then came the SUSHI sell-off by its creator. This led the defi tokens, mainly Ethereum, to severe drops, which did not skip Bitcoin as the primary cryptocurrency.
As of now, Bitcoin marks $9850 as of today’s low, which is an intraday loss of $600. $9850 is also the lowest BTC price recorded since July 26, 2020.
Key Support and Resistance For Bitcoin’s Short-term
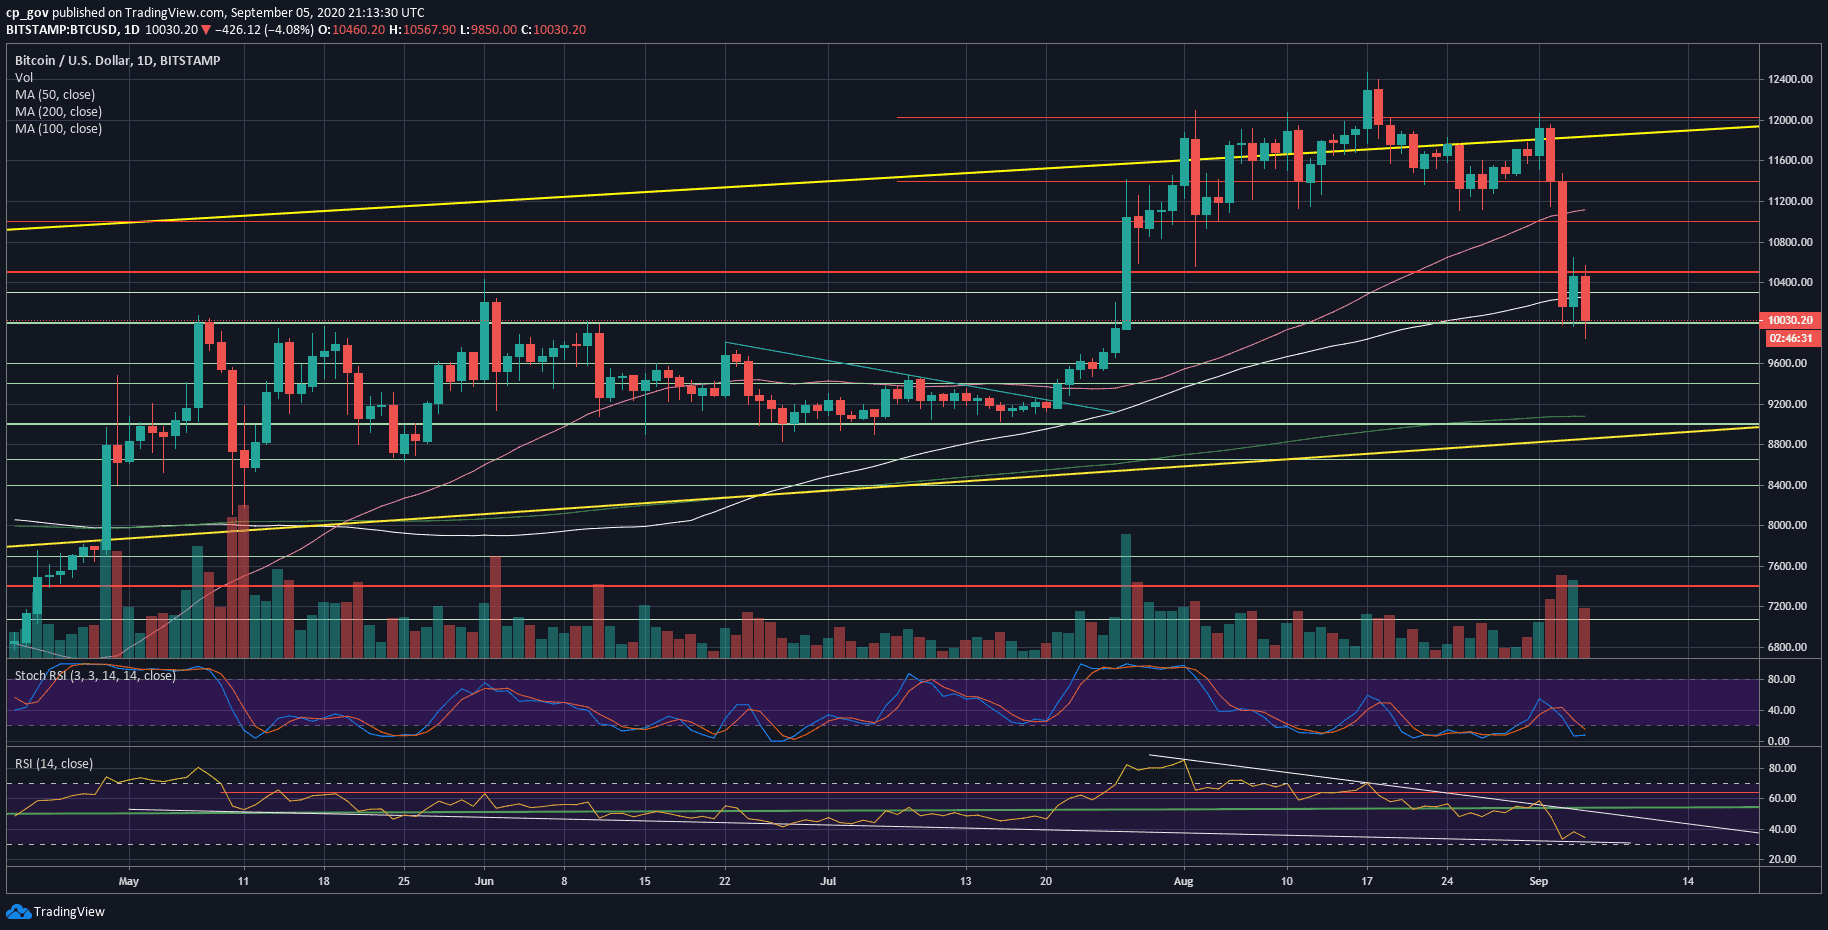
The critical level here is $10,000. There is not much time left for the daily close, and Bitcoin will look to finish today and tomorrow’s candle (the weekly) above $10,000.
In case Bitcoin losses the 5-figures number, then $9800 will be the next support. Further below lies $9600, which is also the CME gap.
If the latter does not hold, then the next support could be found at $9400, followed by the 200-days moving average line at $9100.
On the other hand, there is a high chance that we will see a correction after so much blood. The first level of resistance now becomes the 100-days moving average line at $10,250 (the white line on the daily chart). This is followed by $10,500 – the previous 2020 high before August.
Further above lies $10,800 and $11,000 – $11,100, along with the 50-days moving average line (marked pink on the following daily chart).
From a technical point of view, the RSI is nearing an oversold level. This supports the option of some bullish correction. Adding to the above, there is a little bit of bullish divergence on the 4-hour RSI.
As opposed to the above, the last drops were followed by a huge amount of volume. This is in favor of the bears. Thursday’s sell-off volume was the highest over the past 30-days. So short term, we might be a temp correction; however, mid-term is still bearish until proved otherwise (a weekly close above $11,000).
Total Market Cap: $323 billion
Bitcoin Market Cap: $185 billion
BTC Dominance Index: 57.3%
*Data by CoinGecko
BTC/USD BitStamp 1-Day Chart
BTC/USD BitStamp 4-Hour Chart

The post Bitcoin Fights For $10,000: Is The Sell-Off Over? Updated BTC Price Analysis appeared first on CryptoPotato.