Bitcoin Fails And Breaks Down March-12 Crucial Support. $8200 Incoming? BTC Price Analysis
Over the past two days, Bitcoin was trading between the range of $9200 – $9300. As we mentioned here on our previous BTC price analysis, that area had transformed from being stronger support to being even stronger resistance.
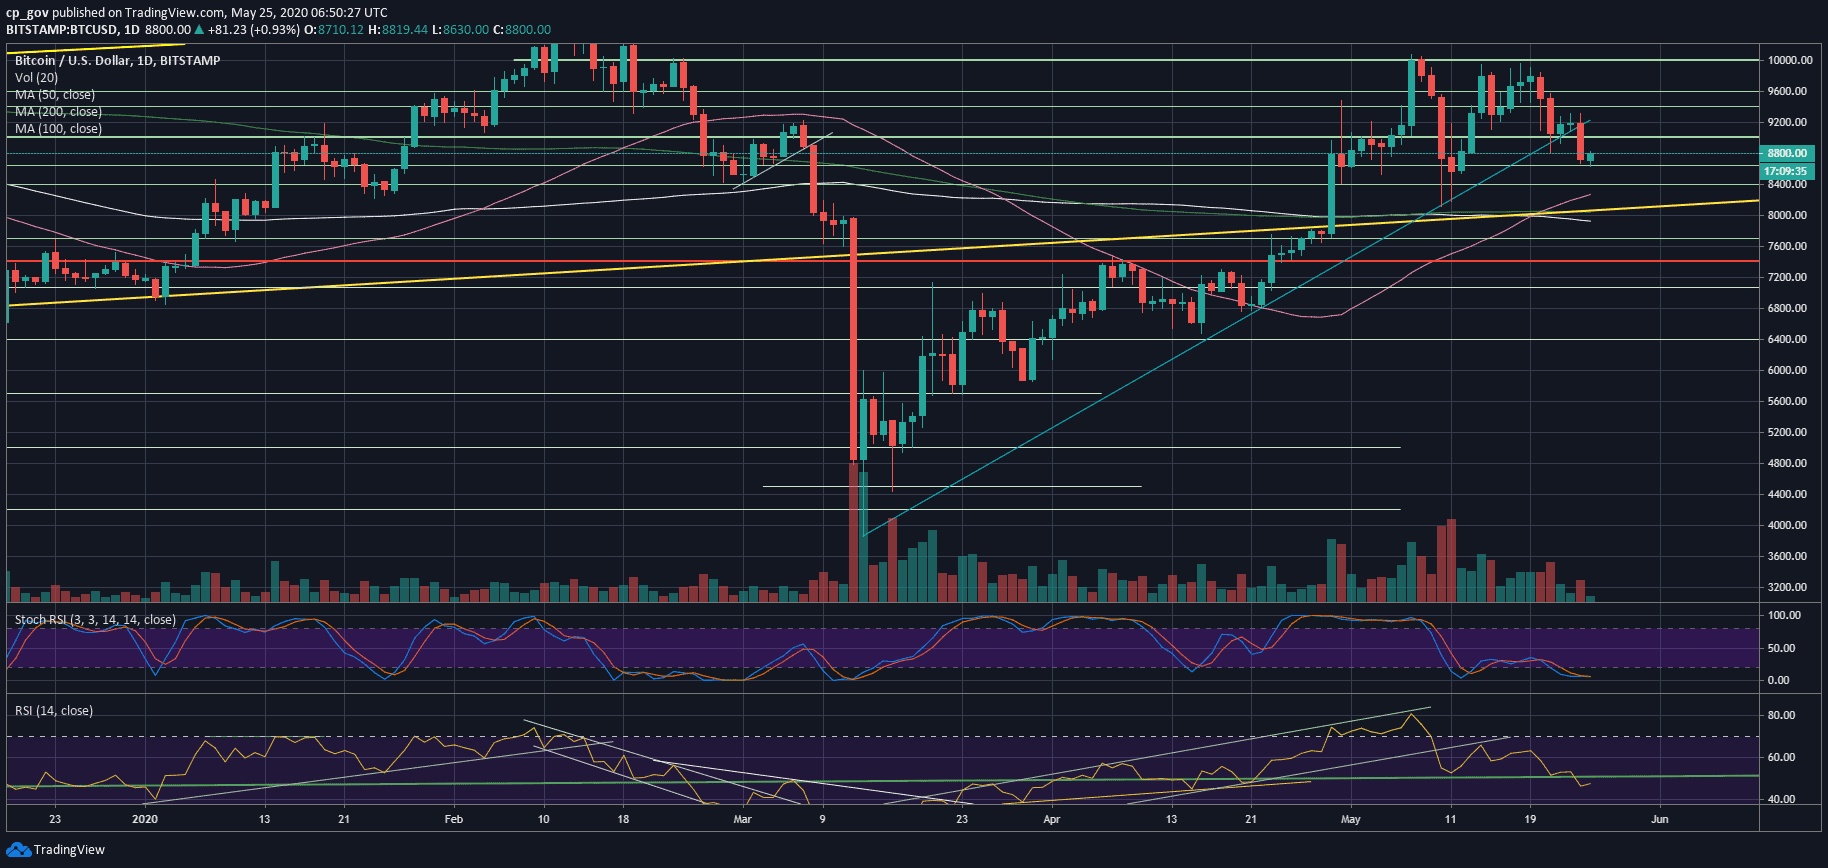
We mentioned the fact that a failure in breaking above the mentioned area will result in a further drop-down. As we noticed over yesterday, Bitcoin failed, broke down the critical blue ascending trend-line, as can be seen on the following daily chart. The primary crypto dropped to our mentioned support at $8650, which was yesterday’s low.
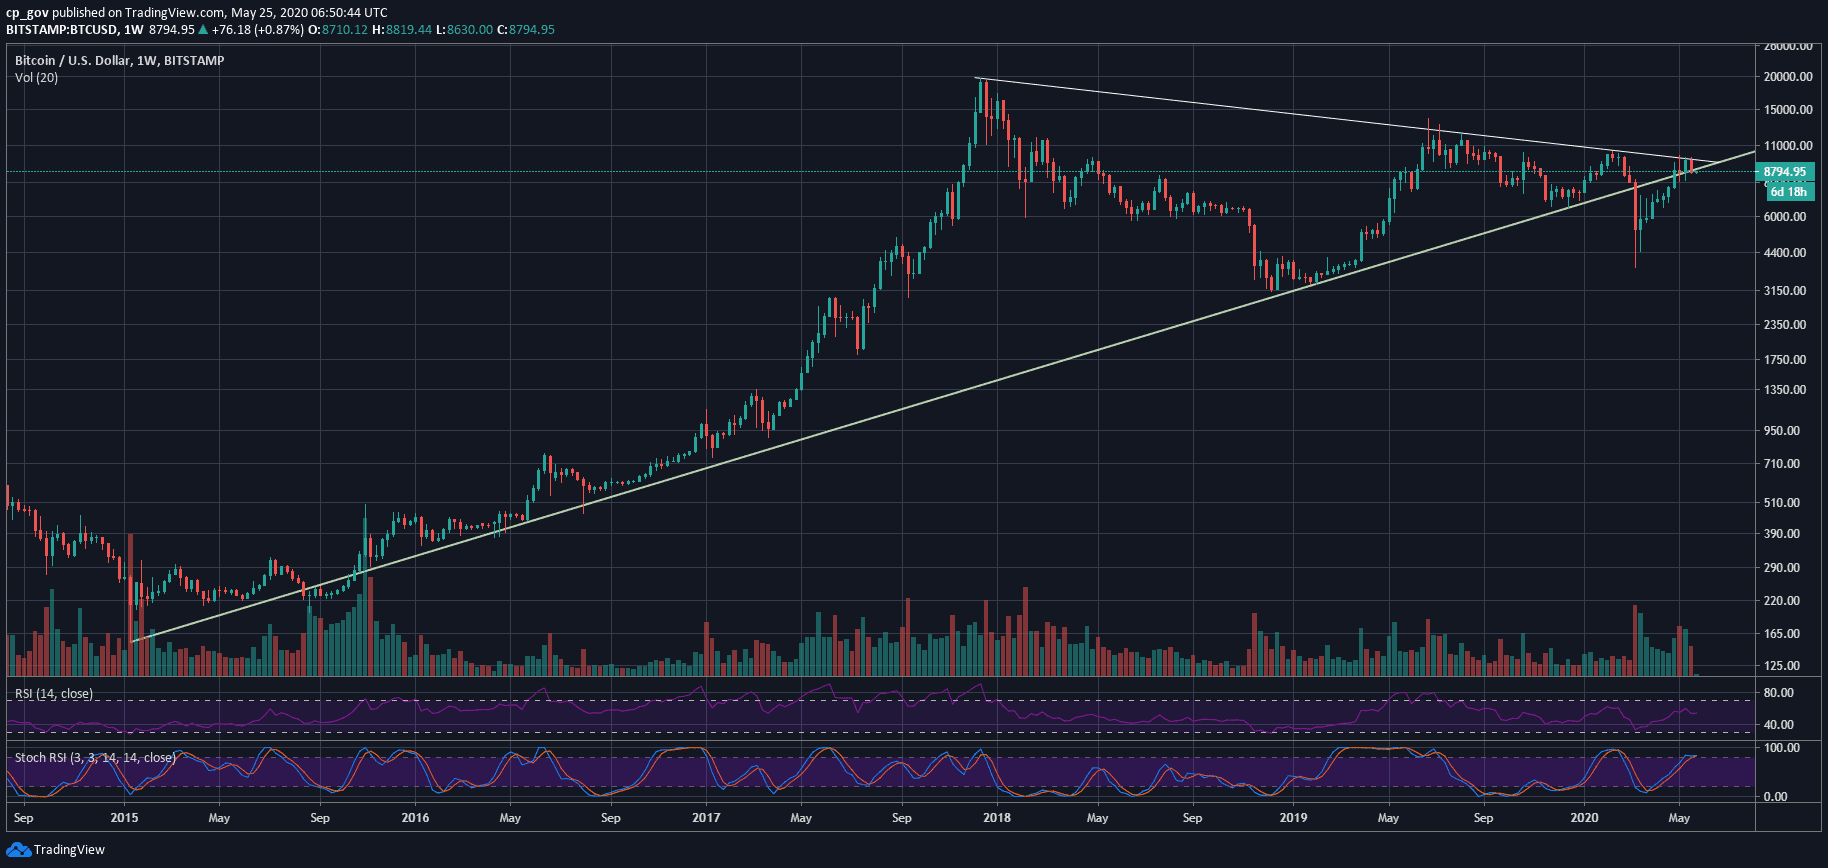
If we look at the macro level, we can see the following triangle formation on the weekly chart, and the fact that Bitcoin failed to break the upper descending trend-line (around $10,000) as resistance and the week’s new candle is starting just below the lower descending trend-line.
In case this weekly candle does not improve upwards, it will be a very bearish sign for Bitcoin’s mid-term.

Total Market Cap: $246.7 billion
Bitcoin Market Cap: $161.8 billion
BTC Dominance Index: 65.6%
*Data by CoinGecko
Bitcoin Short-term Support and Resistance Key Levels
Back to the micro-level.
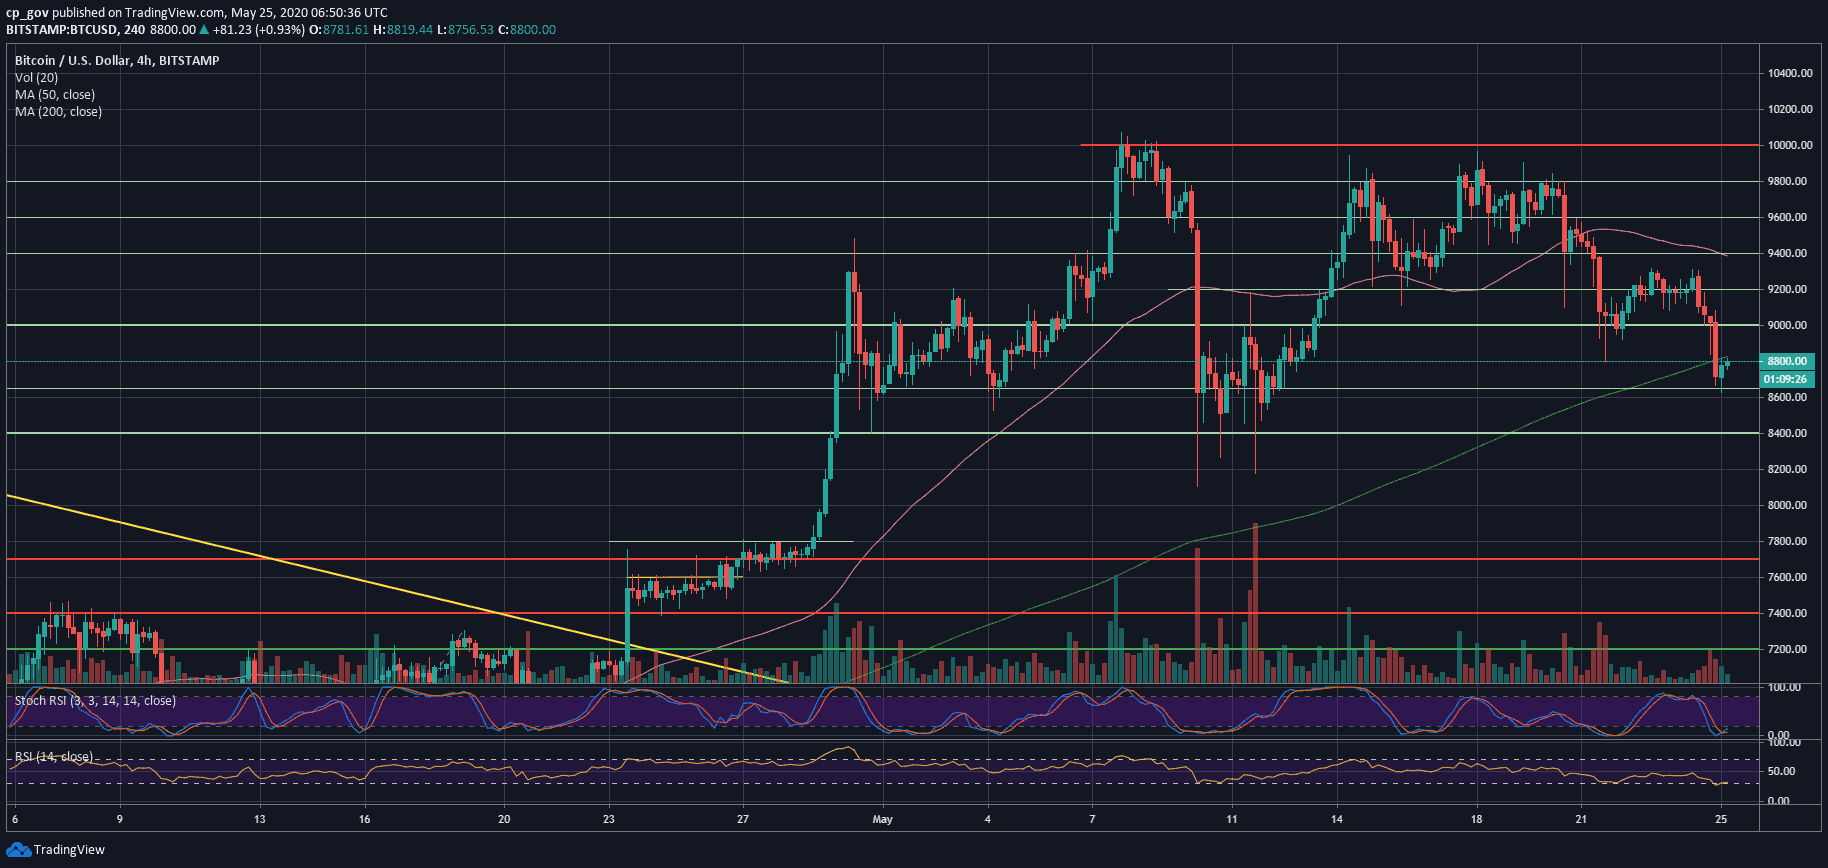
Bitcoin broke down the crucial resistance turned support area at $8800. This now becomes the first major resistance area, along with the $9000 benchmark. In case of a break-up, then the next significant resistance is the mentioned above $9200 – $9300 zone, which Bitcoin failed to break up during the last weekend.
In case Bitcoin fails here, then today’s low around $8600 is the first level of support, followed by $8400 – $8450. Further below lies the 50-days moving average line ($8270), marked by pink line, along with horizontal support of $8000 – $8200 (May’s low).
The Technicals and Trading Volume
Together with the $9200 – $9300 zone, the RSI indicator ‘stopped’ exactly on the 50 line. This is gone now. The RSI, just like the price, is going through lower lows. The first sign of a possible bullish reversal would be to break above the 50 level.
The Stochastic RSI oscillator is at its lowest oversold levels both on the 4-hour and the daily chart.
Despite the price drop from yesterday, the trading volume of yesterday was not significant. However, this doesn’t mean that the Bears will not continue their sell-off.
BTC/USD BitStamp 4-Hour Chart
BTC/USD BitStamp 1-Day Chart

The post Bitcoin Fails And Breaks Down March-12 Crucial Support. $8200 Incoming? BTC Price Analysis appeared first on CryptoPotato.


