Bitcoin Failed To Break The Crucial 2019 Resistance Line: How Low Can It Drop From Here? BTC Price Analysis & Overview
Two days ago, on our most recent BTC price analysis, we had mentioned that Bitcoin is reaching for a crucial long-term resistance line from 2019, we had also mentioned a bearish price divergence on the daily RSI.
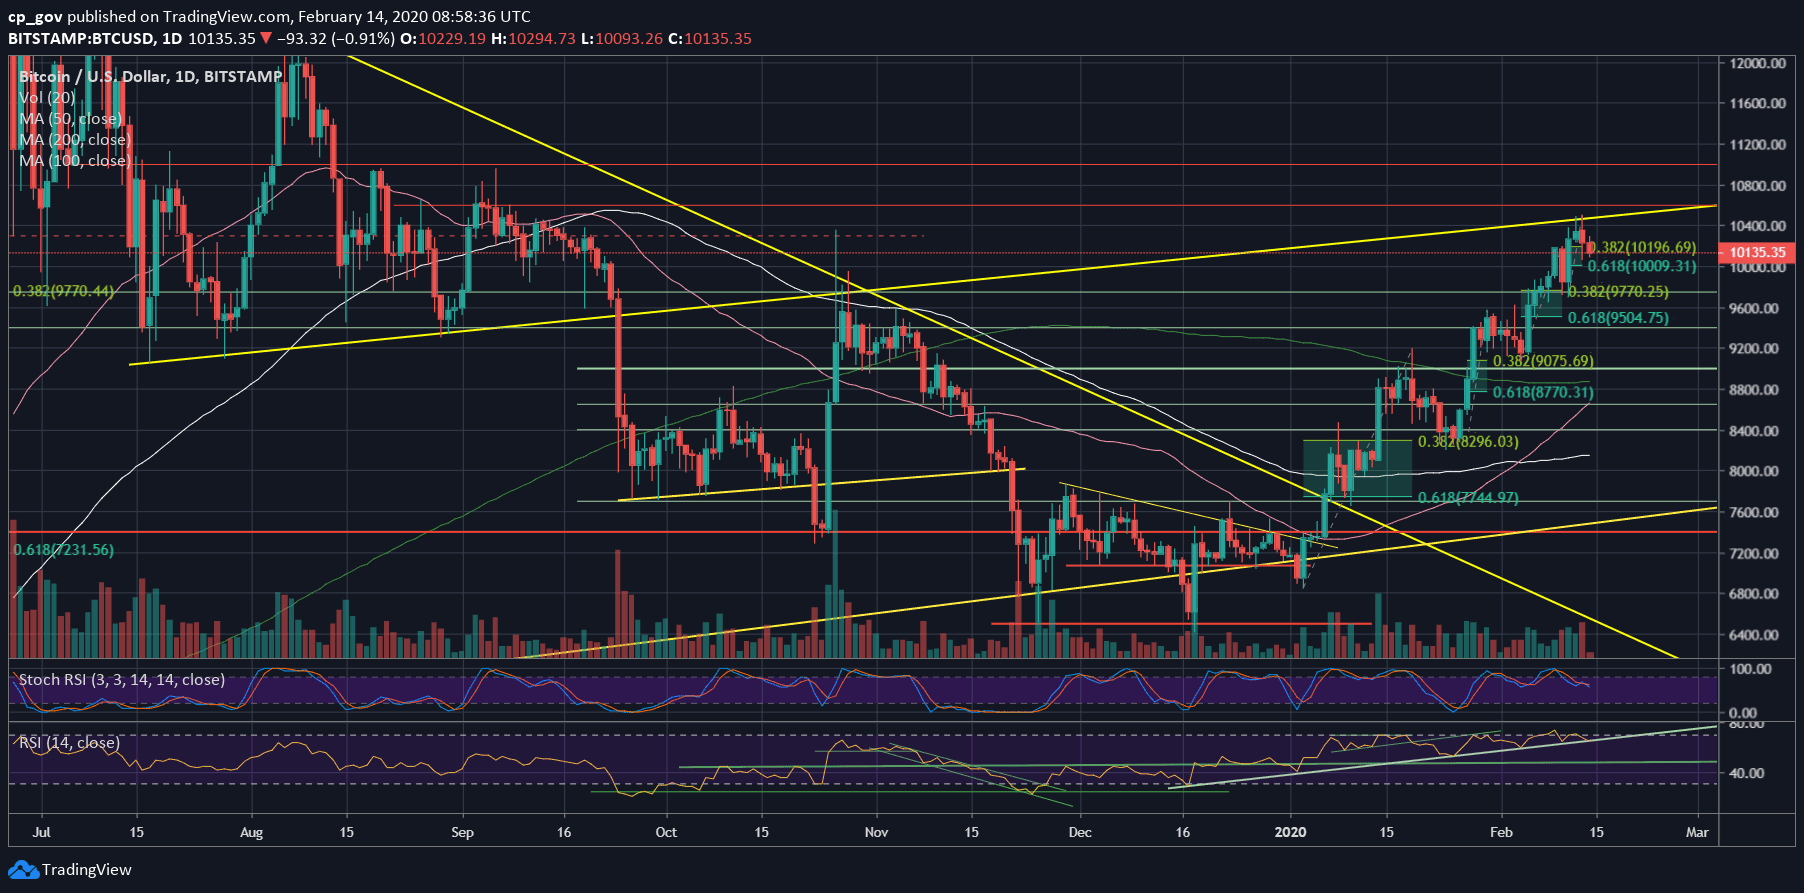
This resistance is the ascending trend-line marked on the following daily chart, which had started forming in July 2019. The line falls precisely on the $10,500 mark. Yes, this is the high of yesterday and the current high of 2020.
After touching $10,500 for the third time in 48 hours, Bitcoin got rejected, and we saw some abnormal behavior on the 15-minute timeframe chart – the last retest of the $10,500 and the rejection to below $10,150 took no more than half an hour.
The bottom line is that Bitcoin might need some more time to regain momentum and try again for the crucial ascending trend-line resistance.
The Mini-Rallies Rule Is Gone
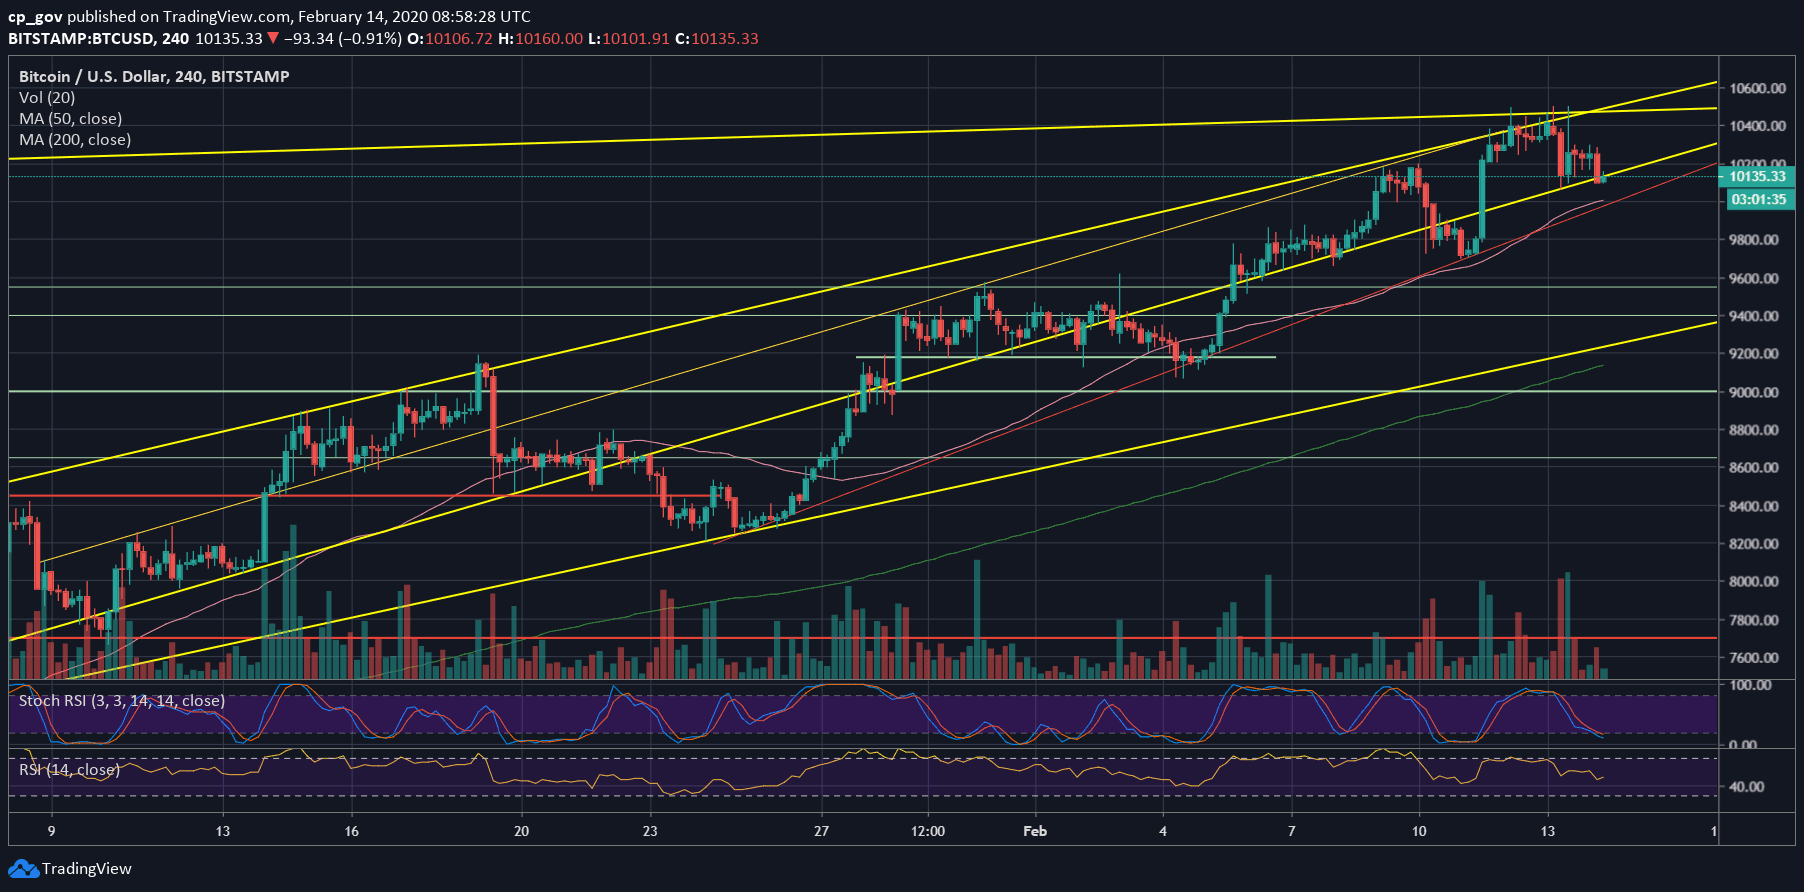
Unlike the past three mini-rallies since 2020 begun, this time the correction was deeper and broke down the significant 38.2% Fibonacci retracement level (~$10,200).
Meanwhile, the altcoins are gaining momentum against Bitcoin, as can be told by the BTC dominance level, which is at its lowest level since July 2019.
Total Market Cap: $299.3 billion
Bitcoin Market Cap: $184.7 billion
BTC Dominance Index: 61.7%
*Data by CoinGecko
Key Levels To Watch & Next Possible Targets
– Support/Resistance levels: Following the rejection of $10,500, Bitcoin is trading below the $10,200 resistance level. The next level of support is around $10,000, which is also the 61.8% Fib level. Further below lies $9900 and $9700.
From above, in case Bitcoin hold above $10,200, then the next level of resistance is $10,300 before the 2020 high at $10,500, along with the significant mentioned ascending trend-line. The next resistance would be $10,600, followed by $11,000 and $11,200.
– The RSI Indicator: We had mentioned a bearish price divergence on our previous analysis. This might have signaled a temp end to the bullish trend of Bitcoin.
However, as of writing these lines, the RSI is encountering the crucial higher lows trend-line. If it fails to find support here, then we can expect the correction to get even deeper.
– Trading volume: Yesterday was the highest volume day since January 28, hence, more than two weeks. This might not be a positive sign for Bitcoin Bulls.
BTC/USD BitStamp 4-Hour Chart
BTC/USD BitStamp 1-Day Chart
The post Bitcoin Failed To Break The Crucial 2019 Resistance Line: How Low Can It Drop From Here? BTC Price Analysis & Overview appeared first on CryptoPotato.