Bitcoin Facing Huge Resistance Expecting Major Price Move Soon (BTC Analysis)
As another week comes to its end, let’s start from the bottom line: Bitcoin price ends the week exactly where it started it, hovering around the $10,600 mark.
It wasn’t a remarkable week for Bitcoin, unlike the other cryptocurrencies, especially the DeFi ones, that saw triple-digit gains.
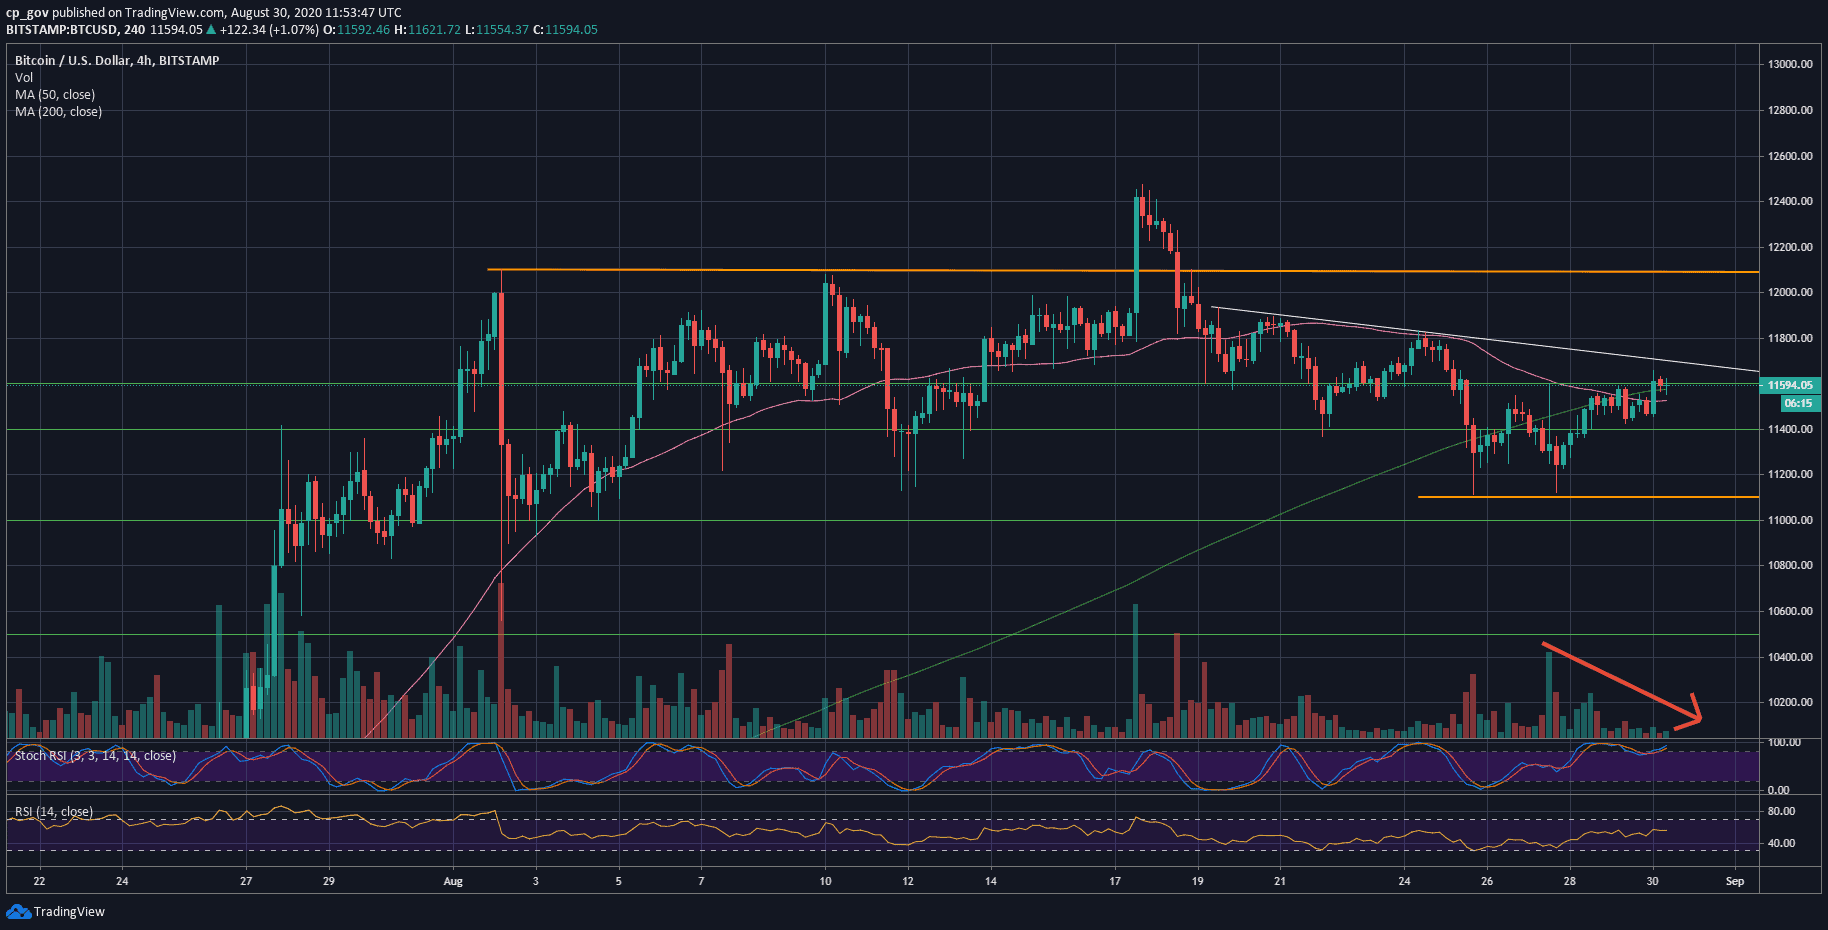
Looking at the shorter timeframe, which is seen on the following 4-hour chart, Bitcoin had formed a double-bottom around $11,100. The latter is considered to be a bullish pattern unless the bottom is broken below.
Shortly after, and for the past three days, Bitcoin was locked again inside the tight range between $11,400 and $11,600. As long as Bitcoin is stagnant, we can assume that the alt-season or the defi-season will continue higher.
However, a declining amount of trading volume, along with the stability of BTC, is likely to produce a strong move to either side. This might also be aligned with the start of a new week tomorrow.
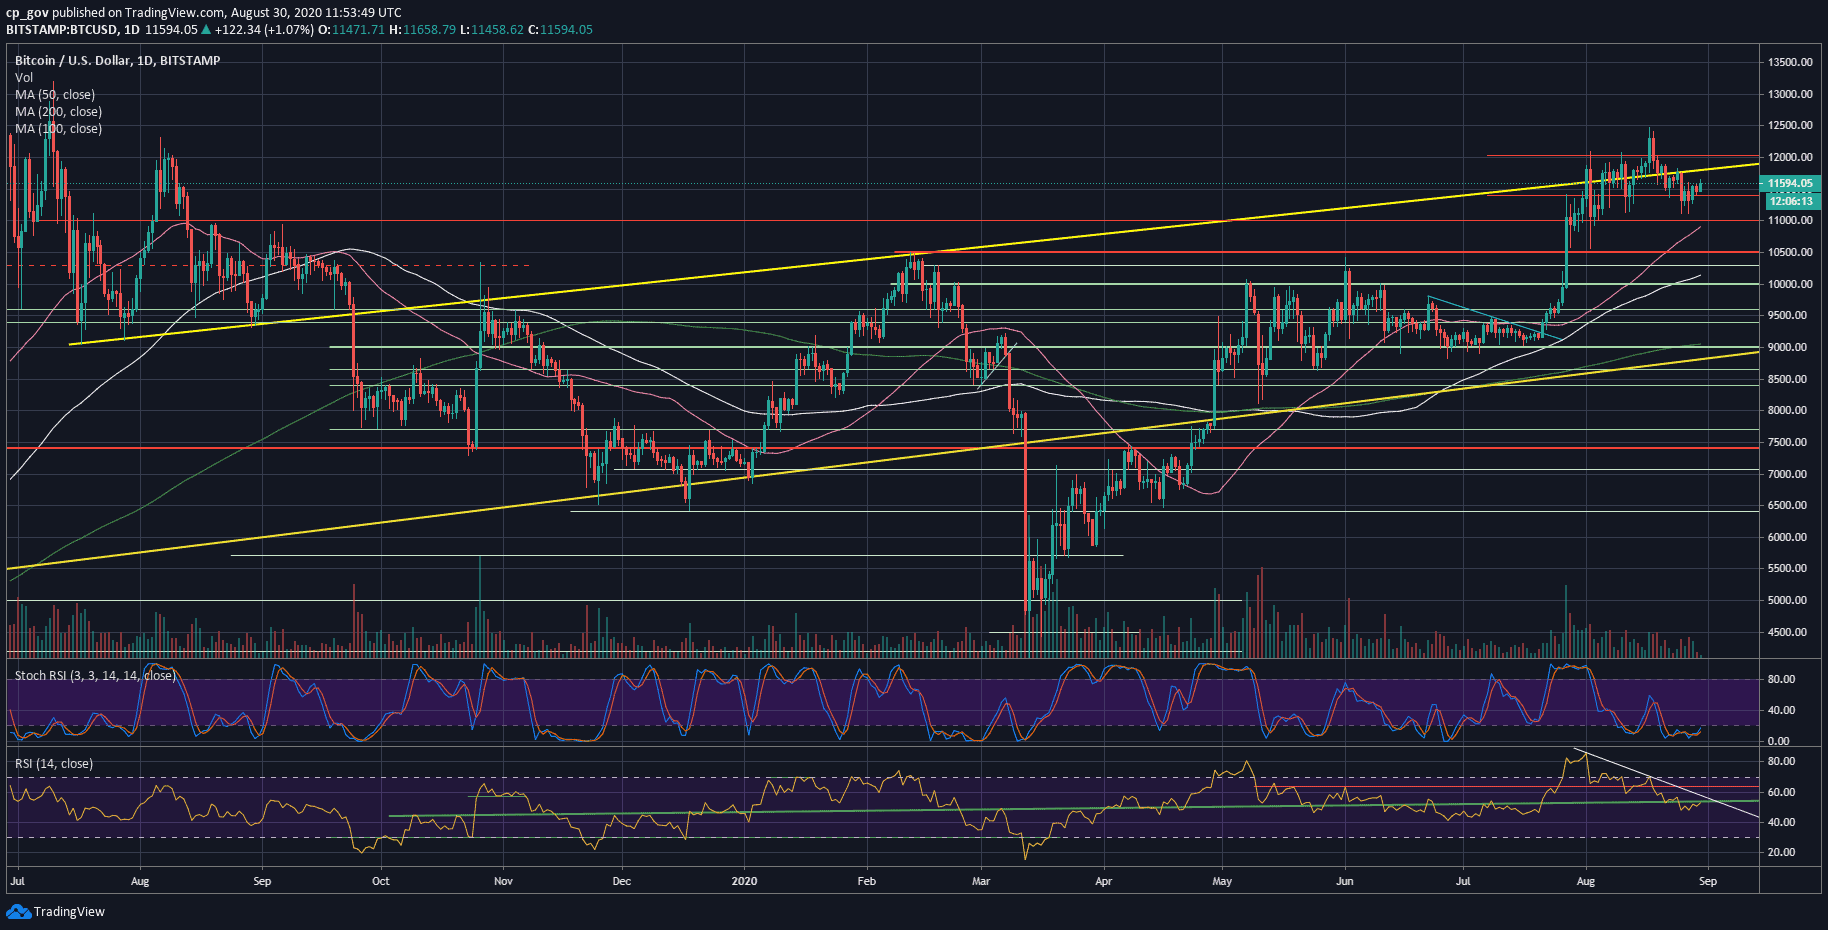
In my opinion, the breakout direction can be to either side. From a bullish perspective, usually after an altcoin run, BTC closes on the range. Besides, the Stochastic RSI oscillator on the daily is about to complete a bullish crossover at the oversold territory.
From a bearish perspective, the daily RSI is patterning a lower high bearish trajectory, along with the low volume we had seen when Bitcoin was trading above $12,000.
Key Support and Resistance For Bitcoin’s Short-term
As of writing these lines, Bitcoin finds trouble to overcome the $11,600 resistance level. In case of a breakup, and we can expect the next resistance at $11,800, which is the past week’s high reached on Monday.
Further above lies the real resistance at $12,000 – $12,100, followed by the 2020 high at $12,500.
From below, the first level of support is the $11,400 area. In case of a breakdown, then the next major level is the past week’s double bottom at $11,100, followed by $11,000, $10,800 and $10,500 (the previous yearly high).
Total Market Cap: $383 billion
Bitcoin Market Cap: $214 billion
BTC Dominance Index: 55.9%
*Data by CoinGecko
BTC/USD BitStamp 1-Day Chart
BTC/USD BitStamp 4-Hour Chart
The post Bitcoin Facing Huge Resistance Expecting Major Price Move Soon (BTC Analysis) appeared first on CryptoPotato.