Bitcoin Faces Sharp Rejection at $40K, Here’s the Level to Watch (BTC Price Analysis)
BTC’s price was unable to reclaim the significant psychological level of $40K and was rejected rather convincingly by the bears. Here are the next important levels to consider.
Technical Analysis
By Shayan:
Long-Term – The Daily

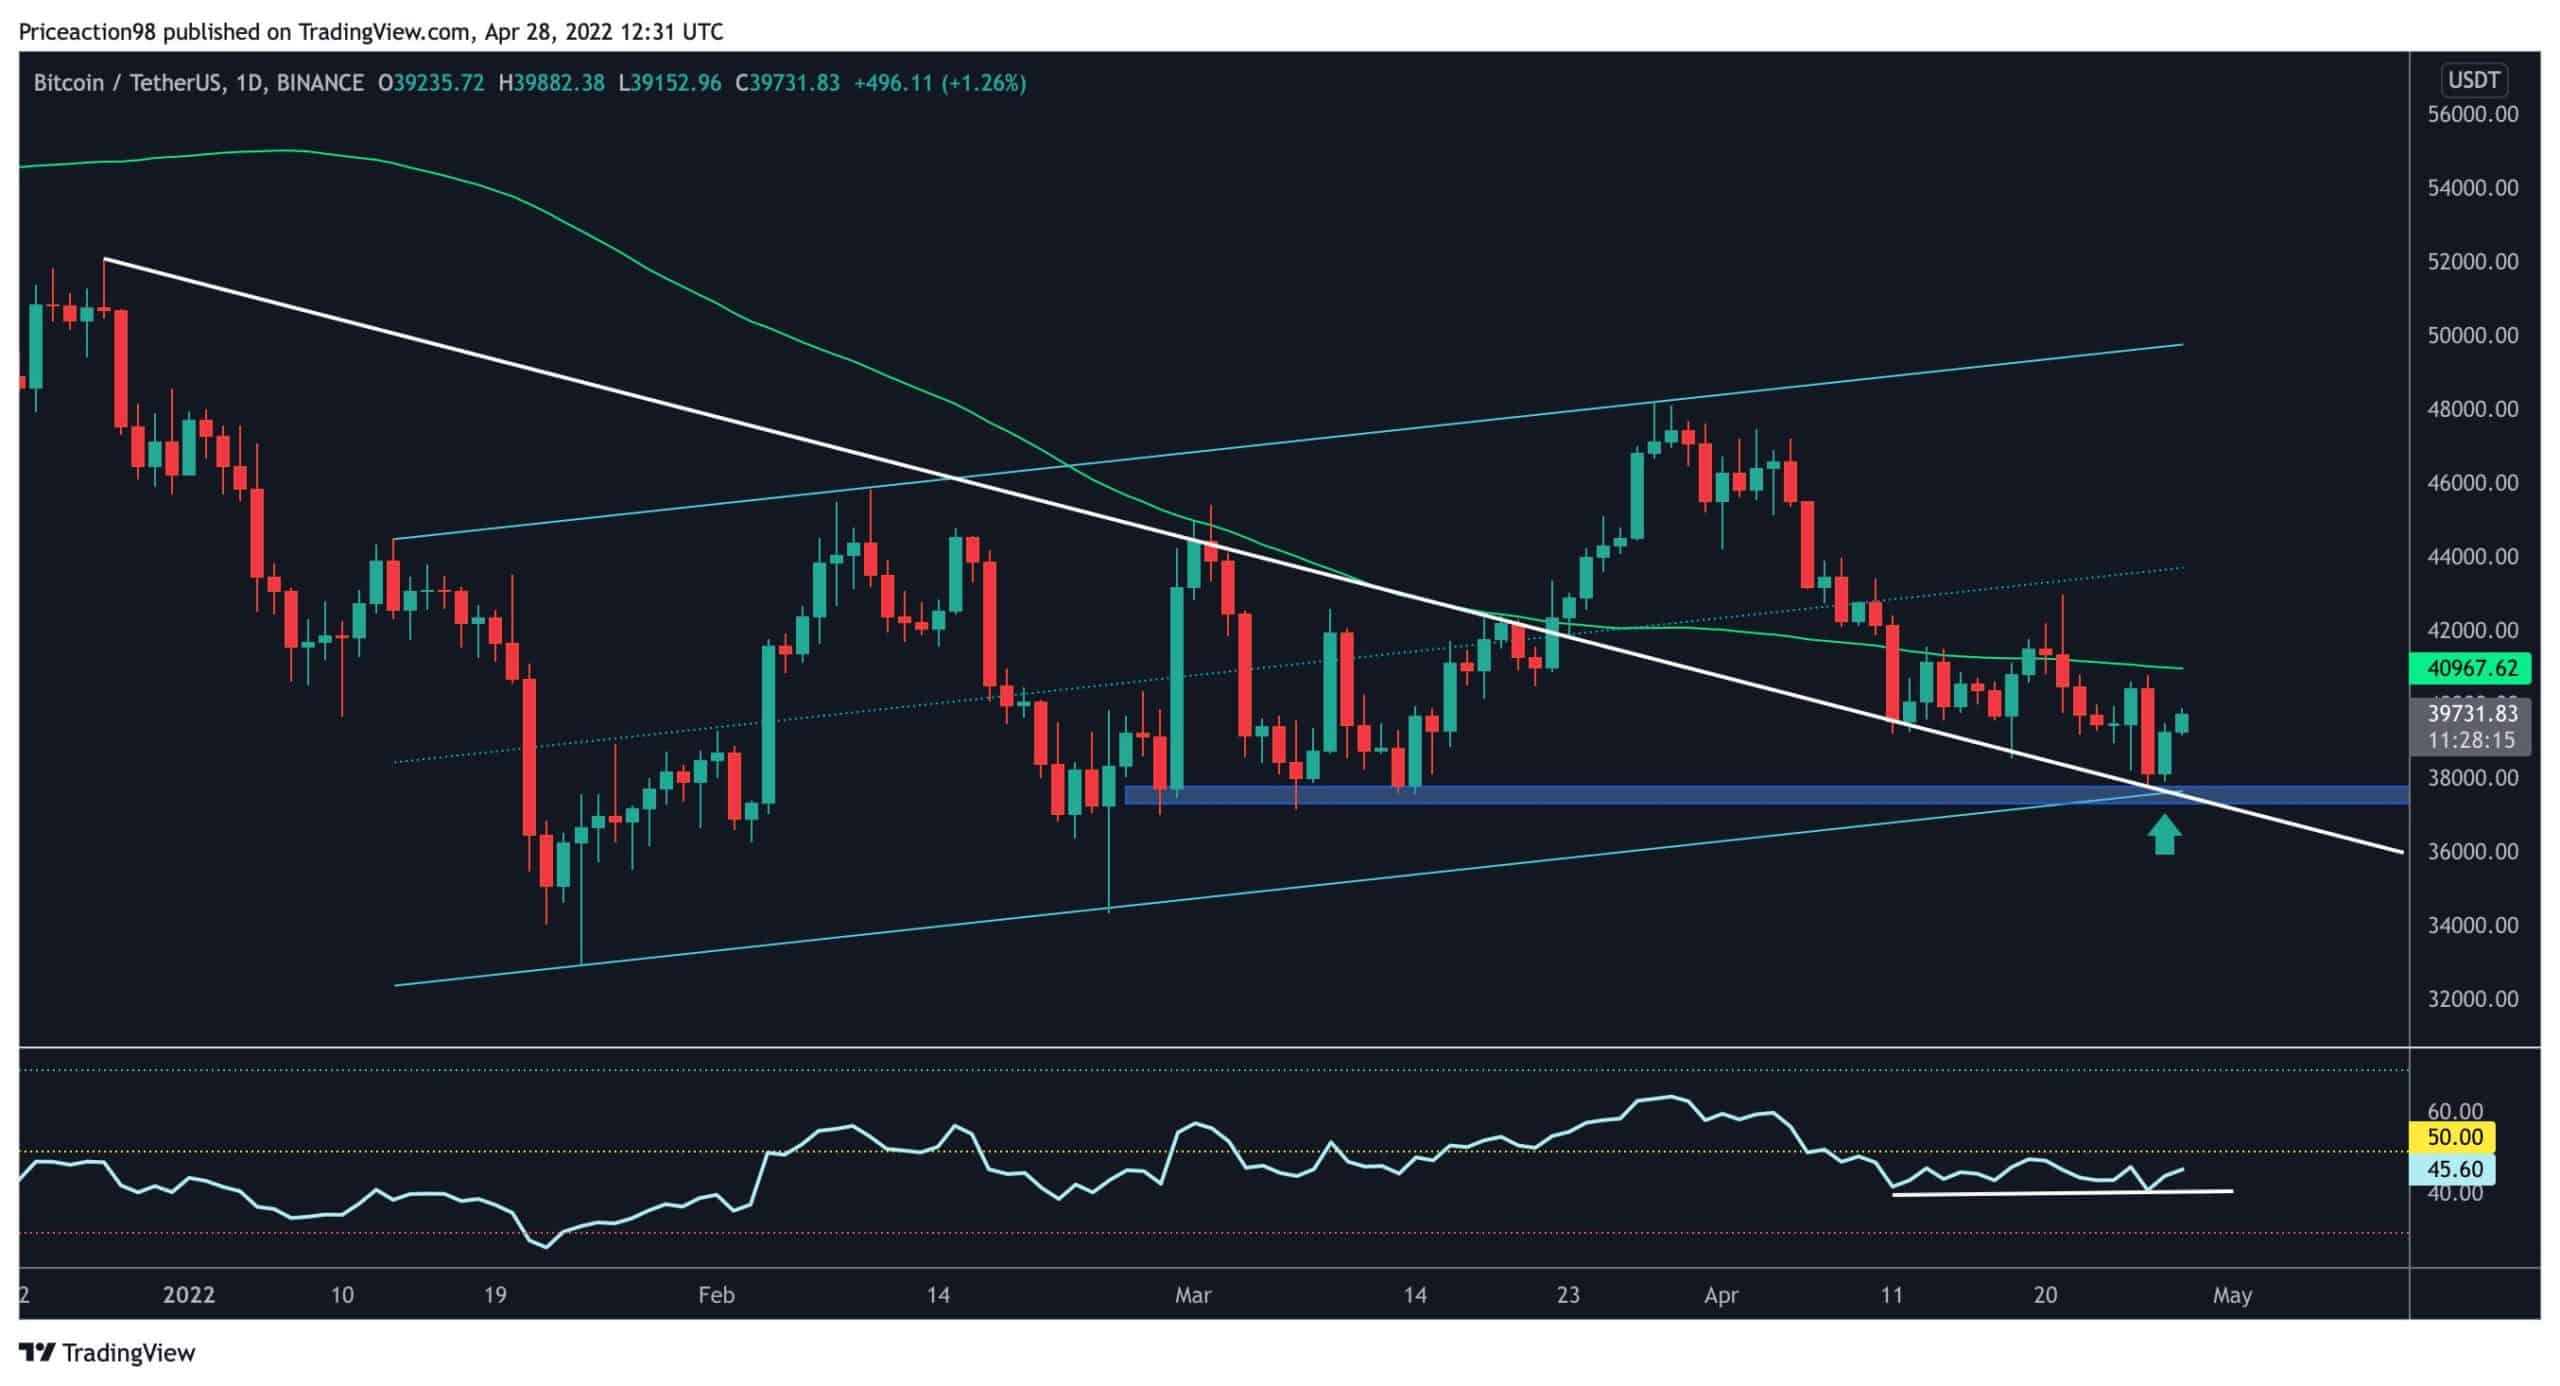
Bitcoin has been consolidating below its 100-day moving average for a few weeks and failed to break above it. The bearish momentum has been weakened, and the price has been supported by the major $37K demand region and the descending mid-term trendline.
The $37K level has now become critical support for Bitcoin, serving as a serious hurdle for bears attempting to push the price down. If it fails, the price will most likely drop to the $30K demand zone. In addition, the RSI indicator is currently around 50%, with a bullish divergence between the RSI and the price, suggesting a reversal and a new bullish leg ahead. On the other side, if Bitcoin is to begin a bullish surge, the buyers must break the 100-day moving average soon to restore confidence in the market.
Short-Term – 4H

As the graph illustrates, the price began a short-term bullish climb toward the $42K level, which is the primary resistance level for Bitcoin in the 4-hour period, after being supported by the important level around $38K and the lower trendline of the bearish continuation flag.
However, unless a breakout over $42K happens, the big picture remains negative. If the price breaks above the $42K level, Higher prices could be expected, leading to a potential bearish flag failure, while if the $37K main support is breached, the $33K-$35K demand area will be the next key support for Bitcoin.
Onchain Analysis
By Edris:
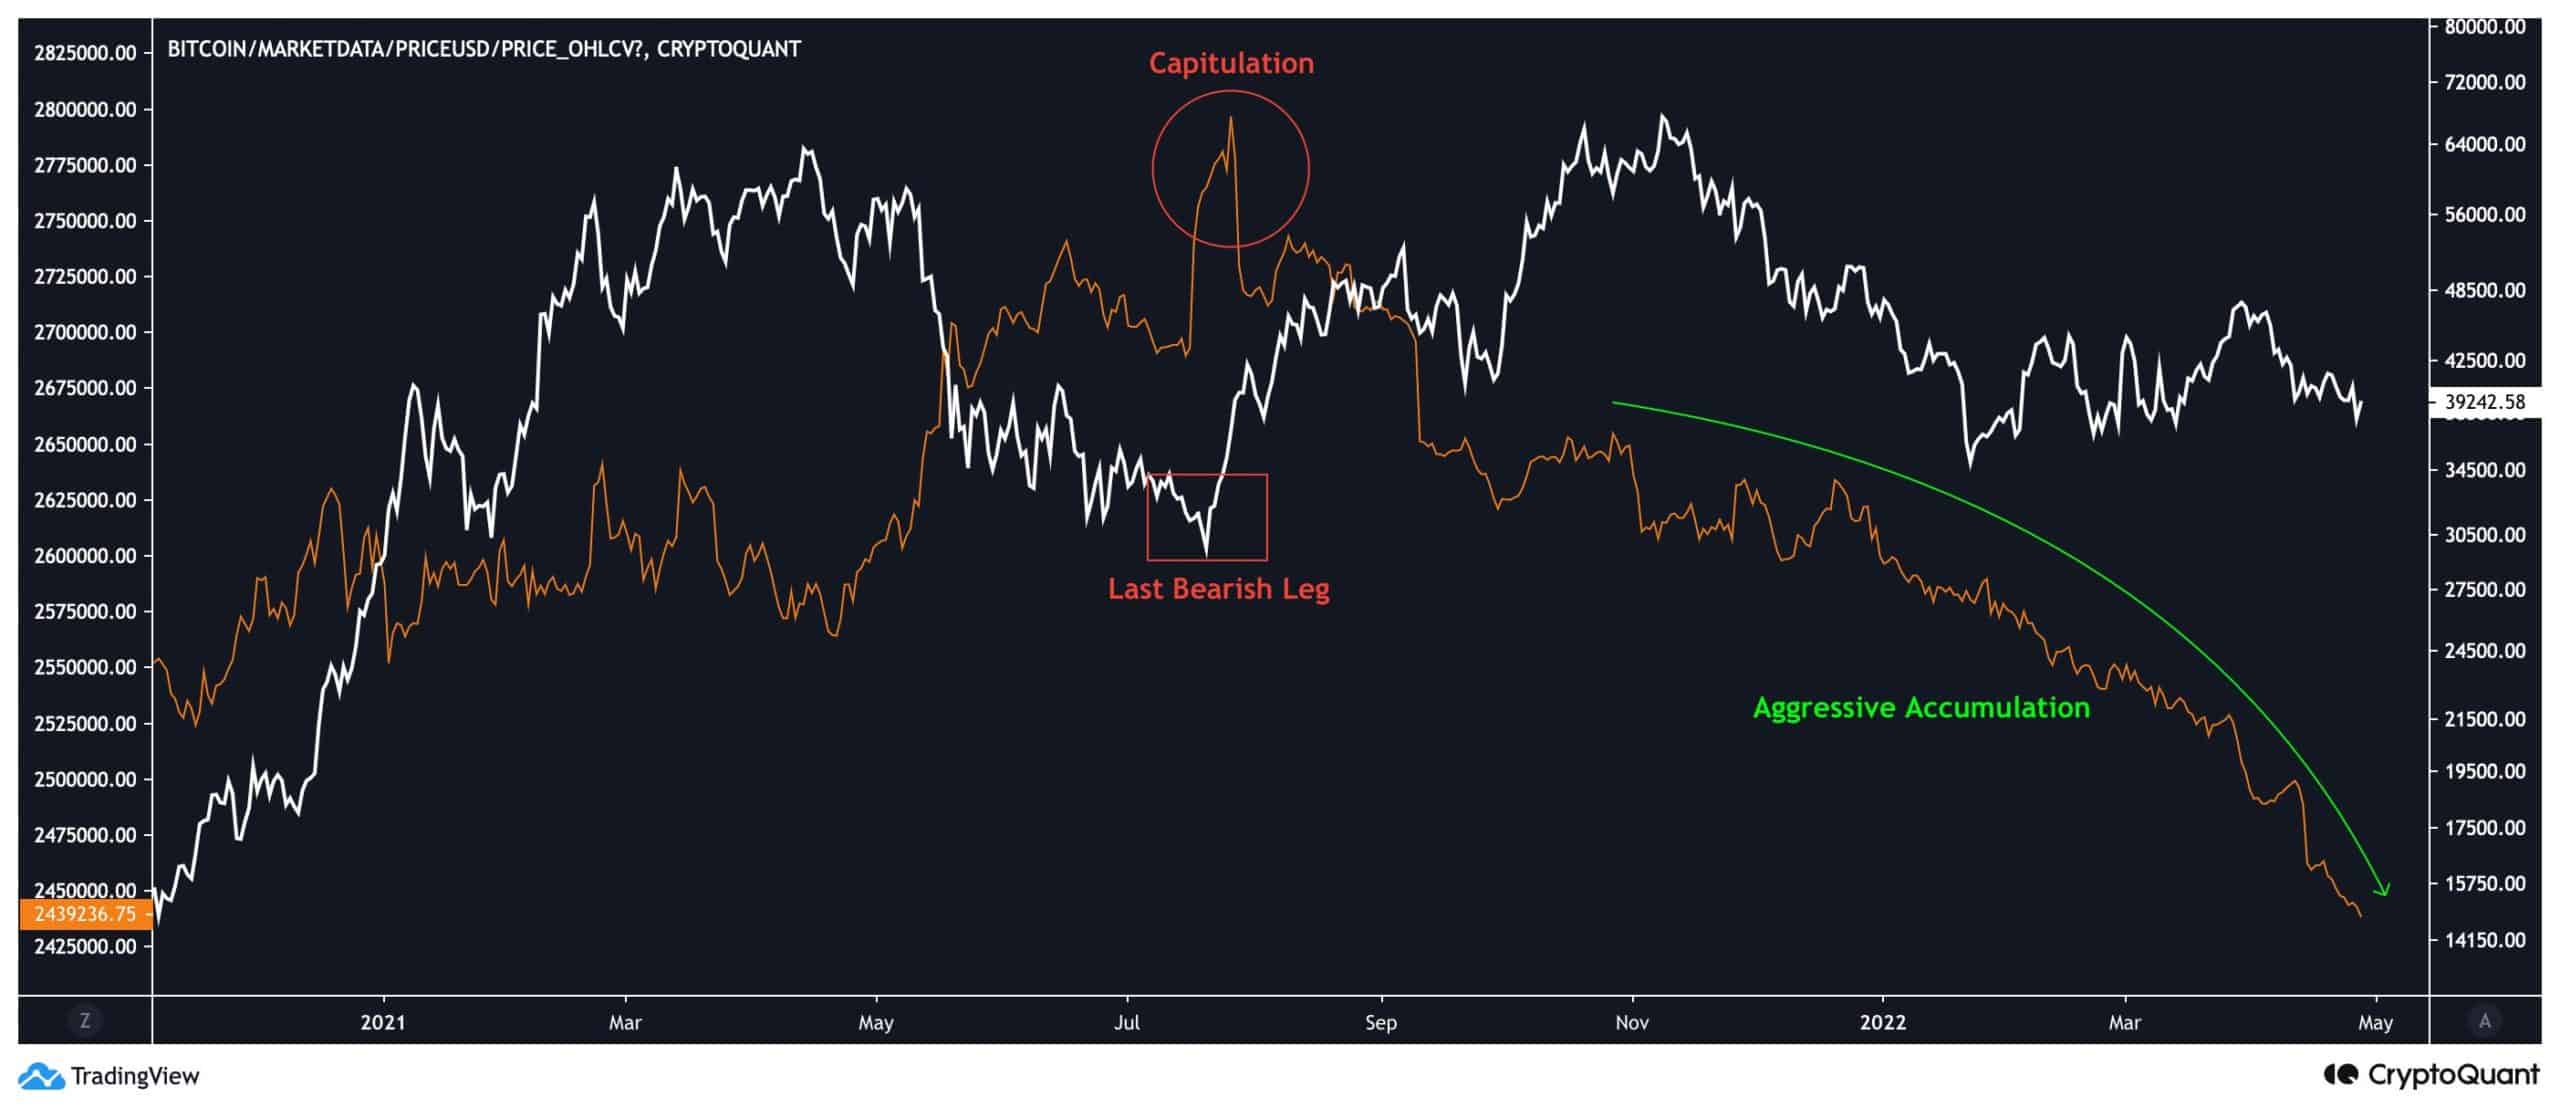
Analyzing the Bitcoin reserve of exchanges is one approach to evaluating the supply and demand equation in the Bitcoin market.
The chart below shows that there has been relentless accumulation over the last few months, while the price has been consolidating in a wide range between $33K and $48K. If enough demand enters the market, a supply shock might occur in the near future. However, it appears that a capitulation phase might take place first, similar to what happened in July 2021 at the $28K low.
This phase would be marked by a significant short-term surge in the exchanges’ reserve while the price falls at the same time as retail investors panic sell their coins.


