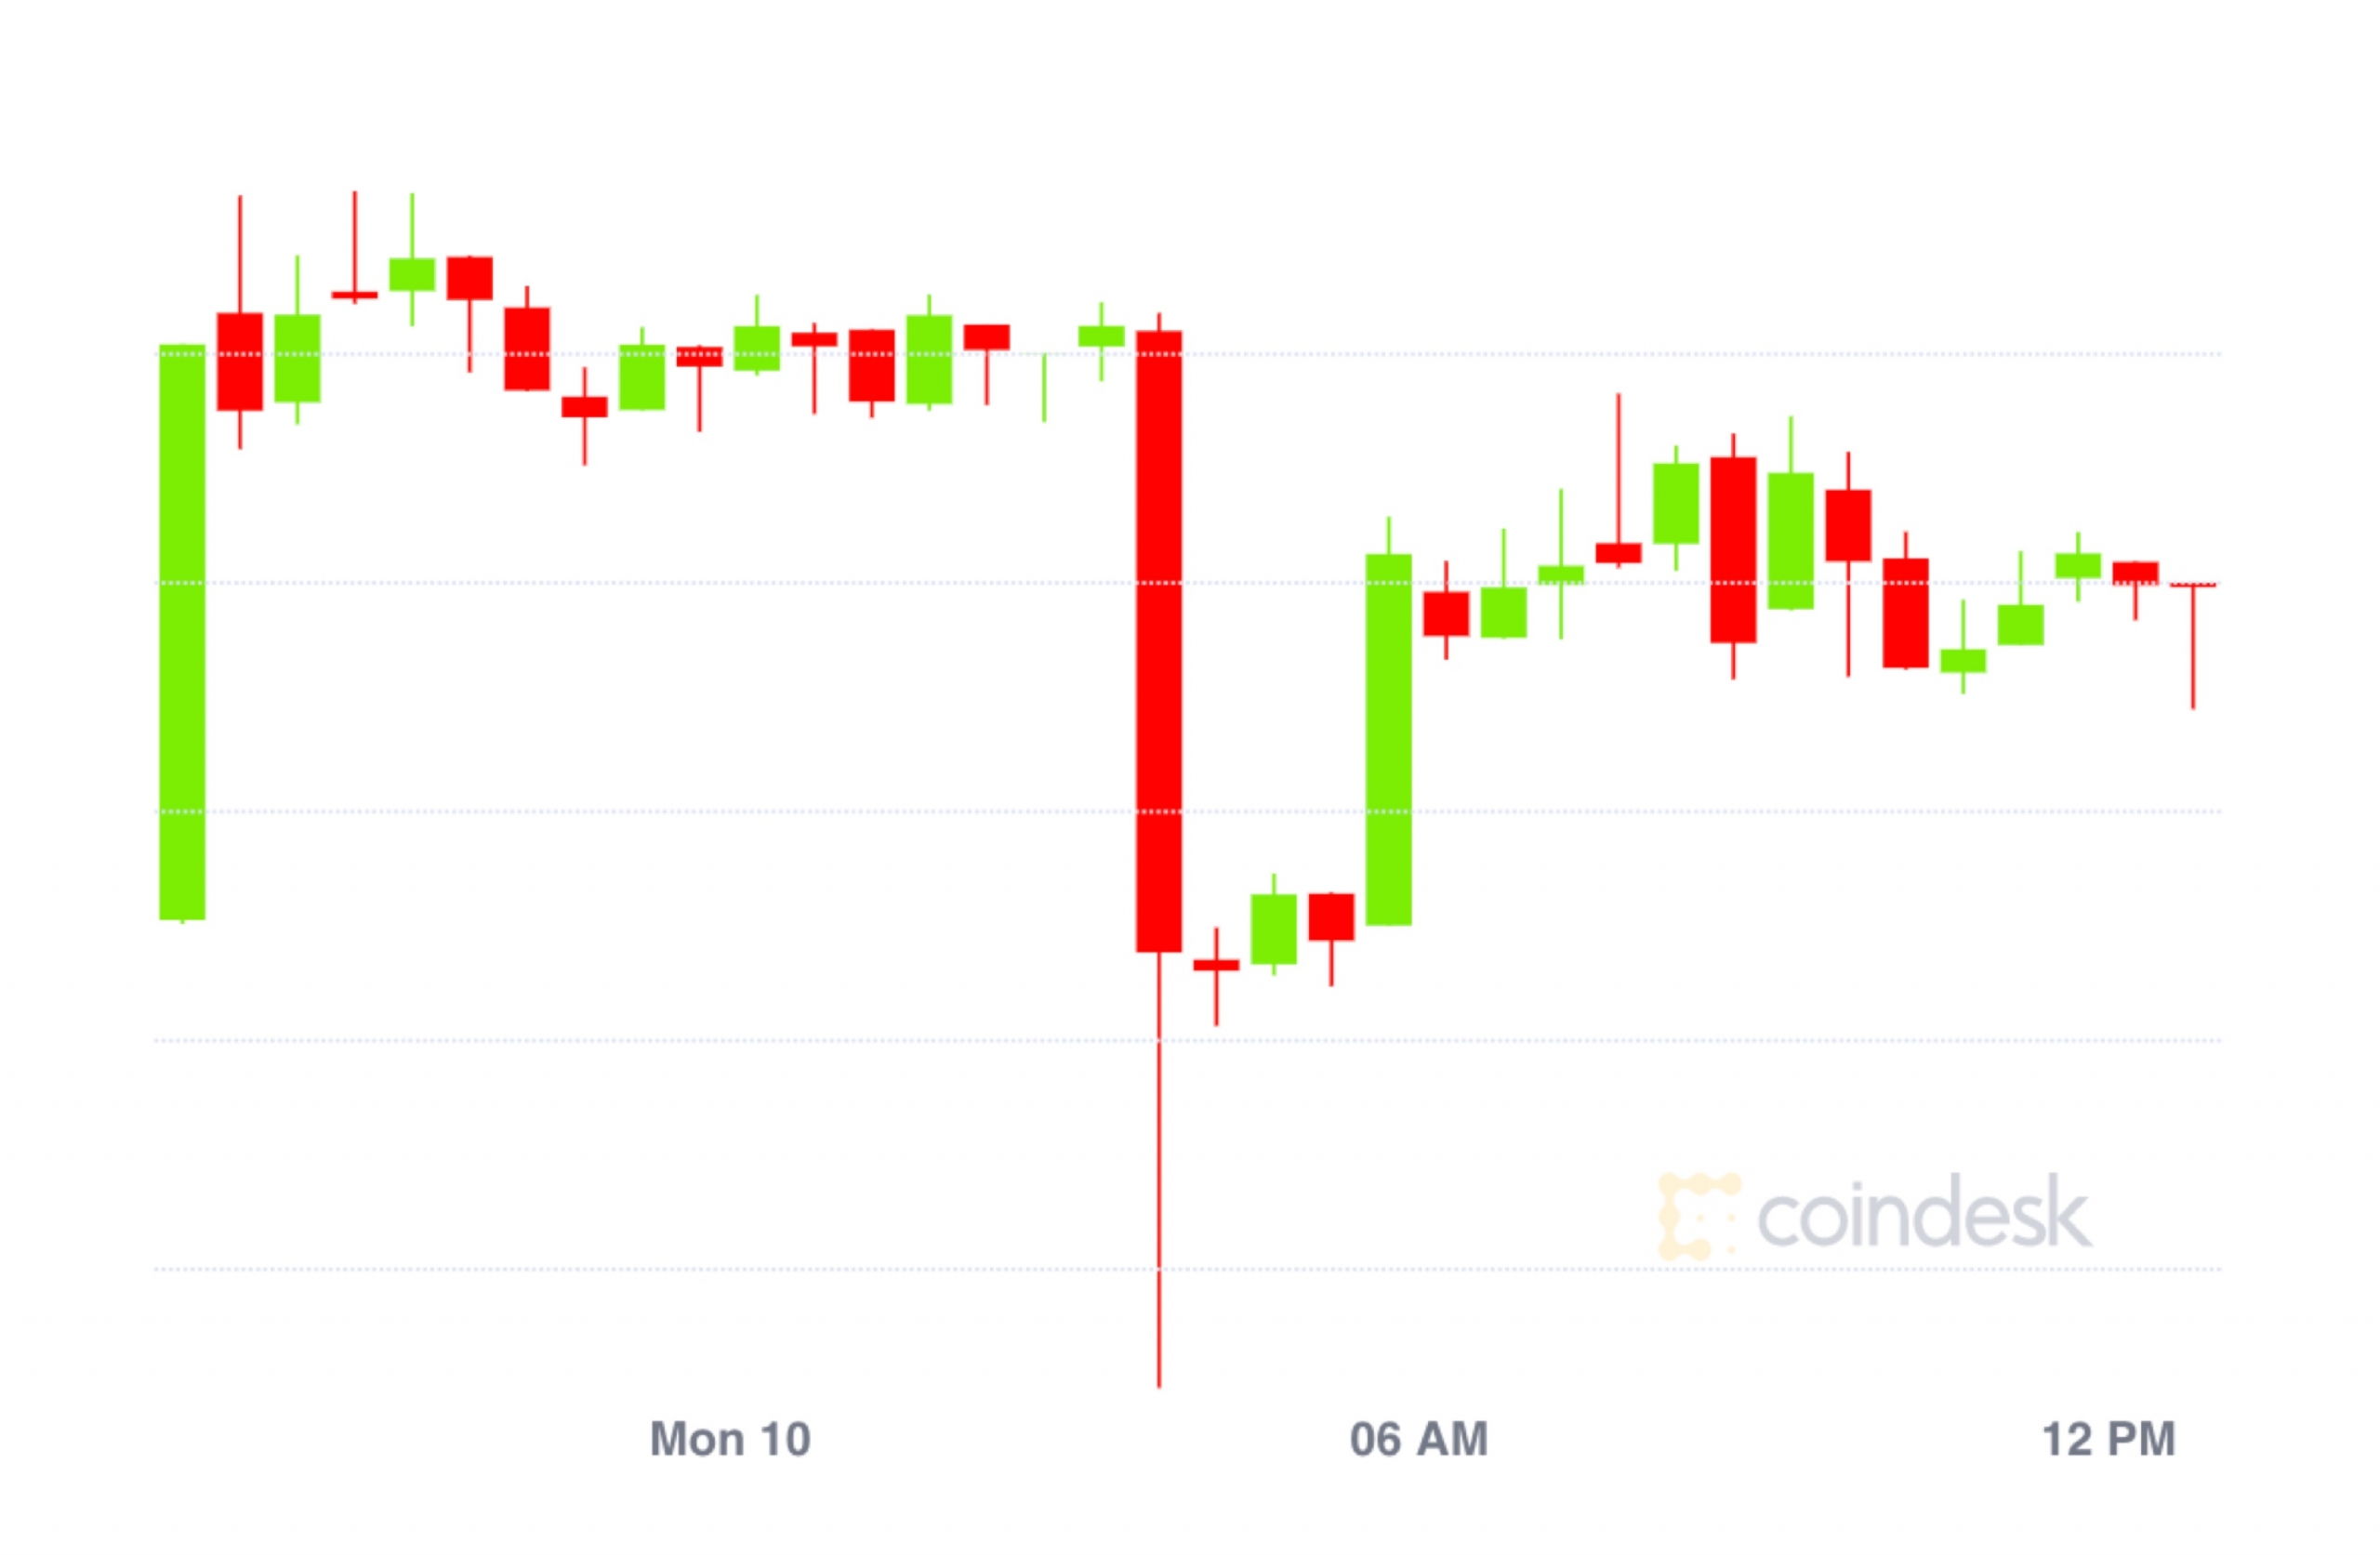
Bitcoin Eyes $9K Price Support After Drop to One-Month Lows

View
- Bitcoin risks falling to $9,000 in the next 24 hours, having dived out of a narrowing price range on Wednesday. A violation there would expose the next support lined up at $8,500.
- The breakdown looks legitimate as it is backed by a surge in selling volumes. The daily chart indicators are also reporting bearish conditions.
- A weekly close (Sunday, UTC) below $9,533 would confirm a double top breakdown on the weekly chart.
- The bearish case would be invalidated above Wednesday’s high of $10,280, although that looks unlikely.
Bitcoin (BTC) could drop to $9,000 in the next 24 hours, having strengthened the short-term bearish case with a drop to one-month lows earlier today.
The top cryptocurrency by market value fell to $9,320 at 07:36 UTC today, the lowest level since July 28, according to Bitstamp data.
Prices fell 4.48% on Wednesday, confirming a downside break of a recent narrowing price range represented by trendlines connecting Aug. 20 and Aug. 26 highs and Aug. 15 and Aug. 22 lows.
Essentially, sellers came out victorious in a tug of war with the bulls, signaling a resumption of the sell-off from the Aug. 6 high of $12,325.
That bearish view has been bolstered by BTC’s drop to four-week lows below the July 15 low of $9,467. As a result, a deeper slide to levels below $9,000 could be in the offing.
As of writing, BTC is changing hands at $9,415 on Bitstamp, representing a 7 percent drop on a 24-hour basis.
Daily chart

The range breakdown and the drop to one-month lows have exposed July’s low of $9,049.
Supporting the bearish case are the downward sloping 5- and 10-day moving averages. The 14-day relative strength index (RSI) has also breached key support (horizontal line) and is reporting bearish conditions with a below-50 print.
What’s more, the cryptocurrency has also found acceptance below the 100-day moving average (MA) – a level which acted as strong support in the seven days to Aug. 27.
Further, the 50-day moving average is beginning to trend south in favor of the bears.
4-hour chart

Trading volumes picked up as BTC dived out of the narrowing price in the U.S. trading hours yesterday. In fact, the selling volume witnessed in the four hours to 20:00 UTC on Wednesday was the highest since Aug. 7.
All-in-all, the stage looks set for a deeper drop in BTC. Acceptance below the July low of $9,049 would open the doors to $8,500.
The bearish case would be invalidated if the cryptocurrency finds acceptance above Wednesday’s high of $10,280, although, as of writing, that looks unlikely.
Weekly close is pivotal

Bitcoin’s weekly line chart shows the cryptocurrency has charted a double top bearish reversal pattern with neckline support at $9,533. As of writing, prices are trading below the neckline support.
The breakdown, however, would be confirmed, only if prices print a UTC close below $9,533 on Sunday. That would create room for a sell-off to lows below $7,550 (target as per the measured move method).
The double top breakdown, if confirmed, would imply an end of the rally from lows near $4,050 seen on April 1.
It is worth noting that that the moving average convergence divergence histogram has already confirmed a bearish reversal with a drop below zero – the first since February.
Disclosure: The author holds no cryptocurrency assets at the time of writing.
Spiral staircase image via Shutterstock; charts by Trading View


