Bitcoin Explodes Toward $63K But is the Bull Run Getting Back? (BTC Price Analysis)
Bitcoin’s price has failed to continue its upward trajectory since dropping from the $75K level. Yet, a new bullish wave might begin soon.
Technical Analysis
By TradingRage
The Daily Chart
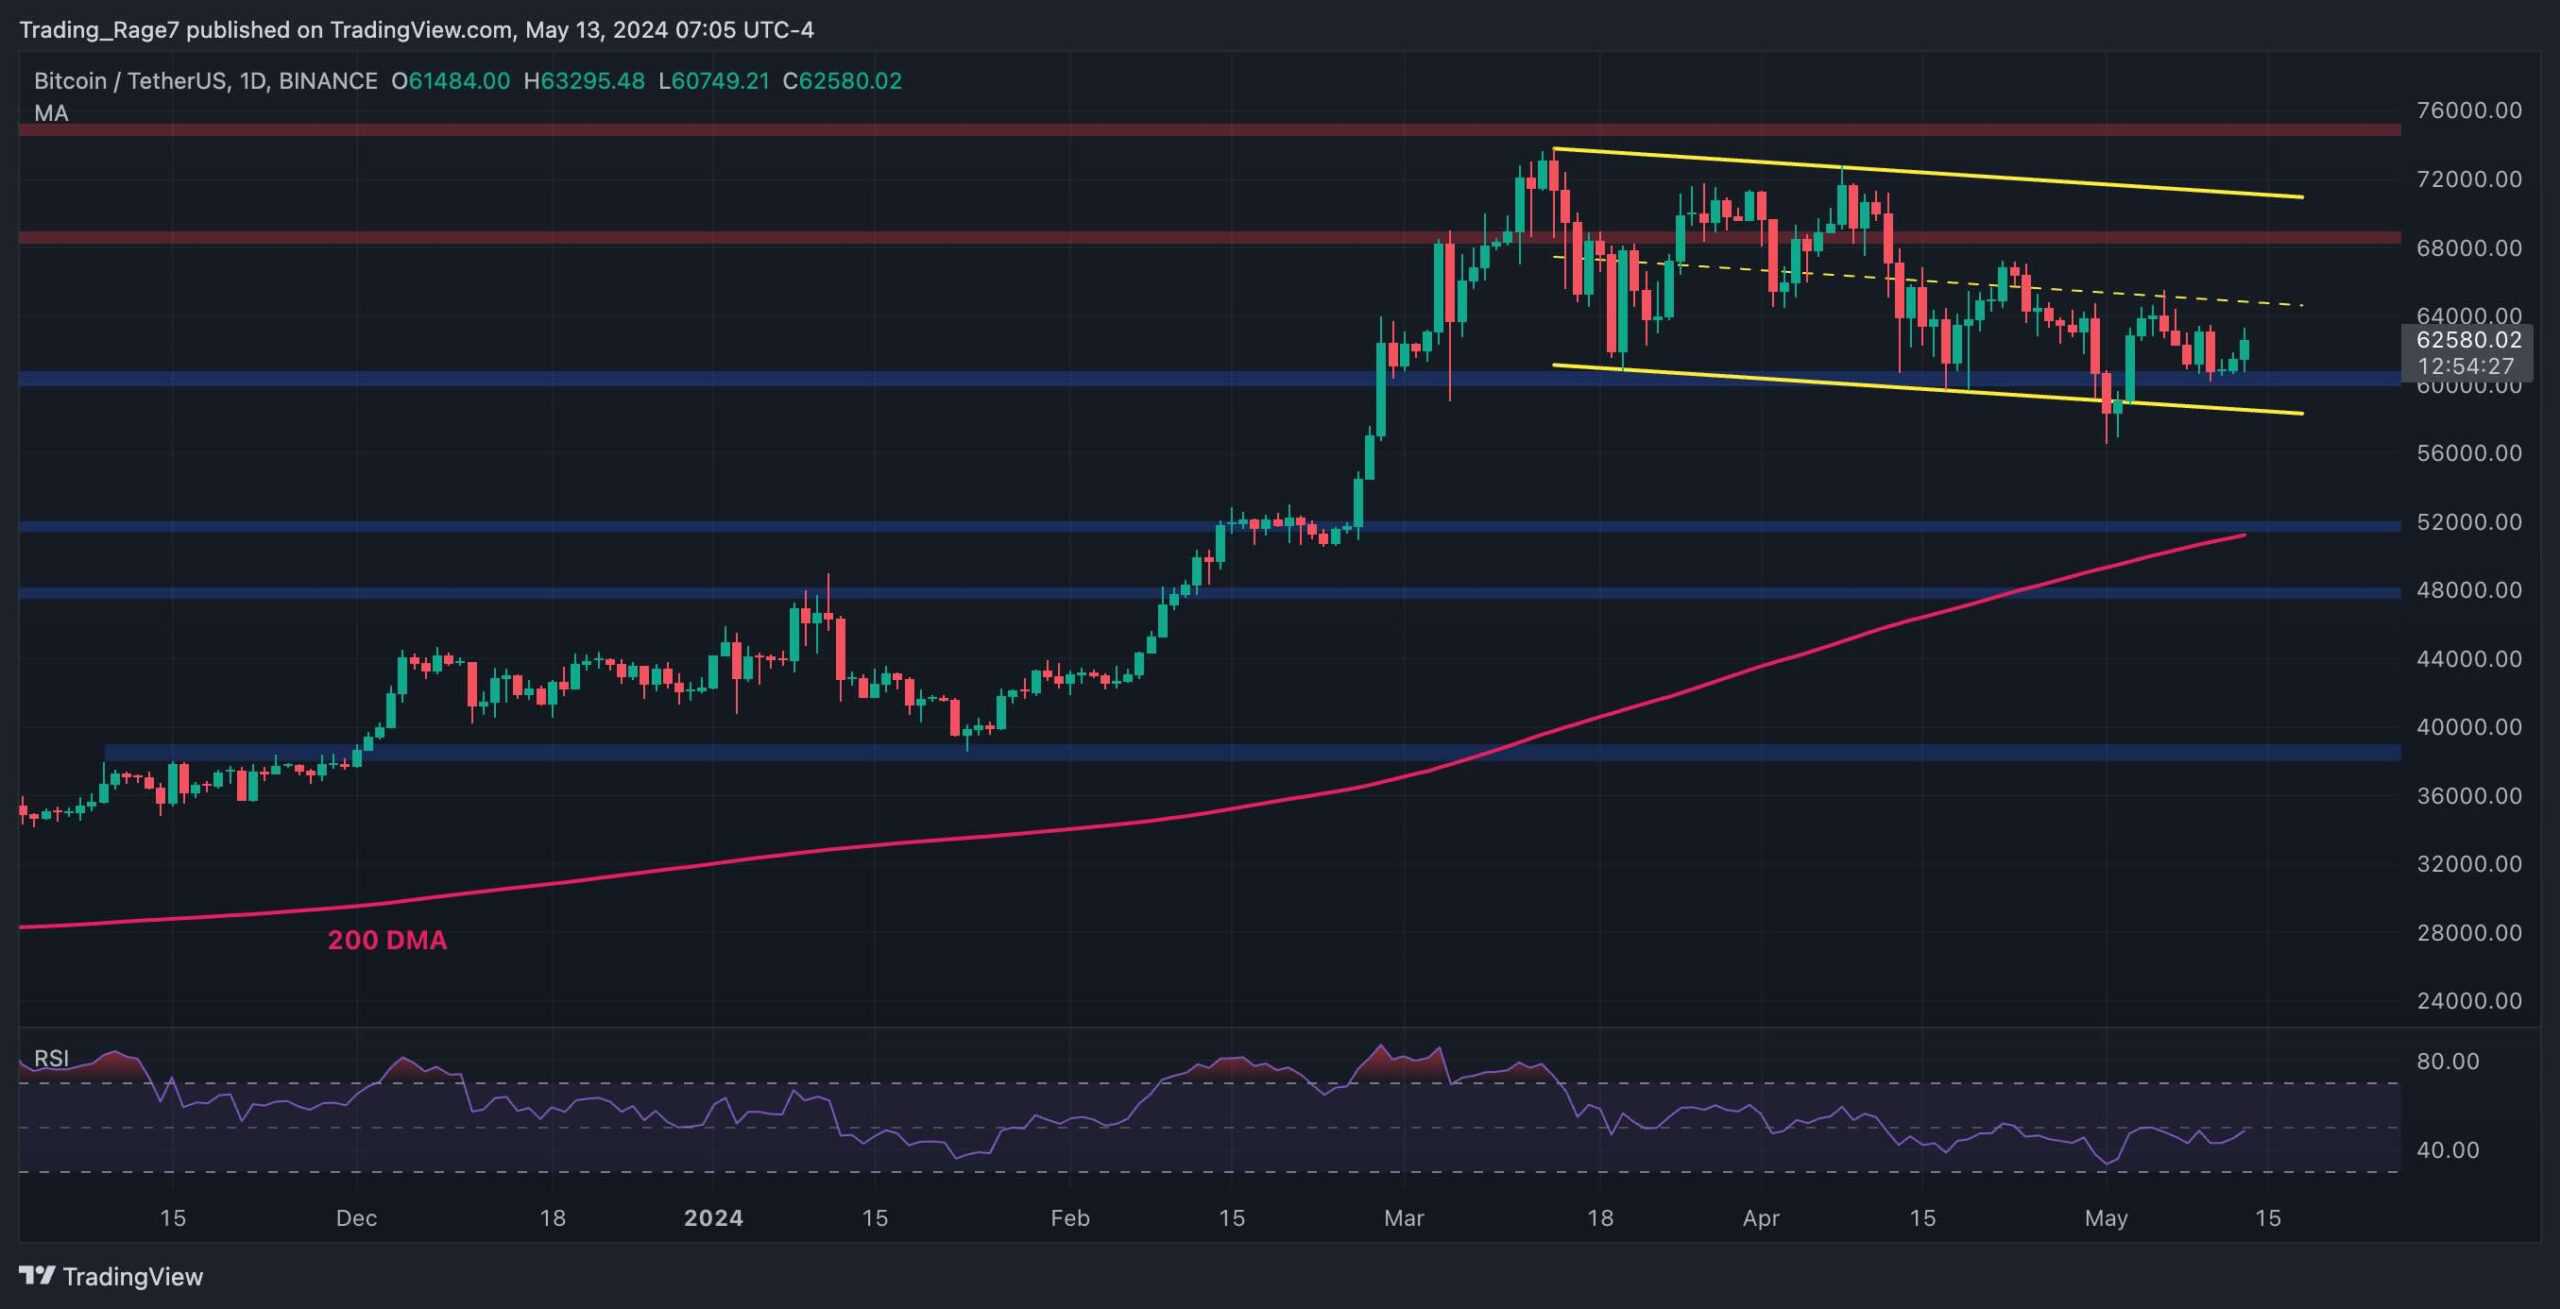
On the daily chart, the BTC price has been trapped inside a large descending channel pattern, making lower highs and lows. While some consider the recent price action as a bearish reversal and downtrend, the momentum is not so bearish.
The $60K support zone has also held the price on multiple occasions, and the market seems to be targeting the channel’s higher boundary.
So, a breakout above the pattern can be a decisive sign for a new bullish trend, while a drop below it would be disastrous as the market can crash toward the $52K support level in no time.
The 4-Hour Chart
The 4-hour chart supports the analysis made on the daily timeframe. The price has rebounded from the $60K support zone recently and is testing a short-term resistance level around the $63,500 mark.
The Relative Strength Index has also risen above the 50% mark, indicating that the momentum is bullish once more. As a result, the $63,500 level could be broken soon, and the price can rally toward and even beyond the midline of the channel. This could be a probable scenario to initiate a price rally toward new all-time highs.

Sentiment Analysis
By TradingRage
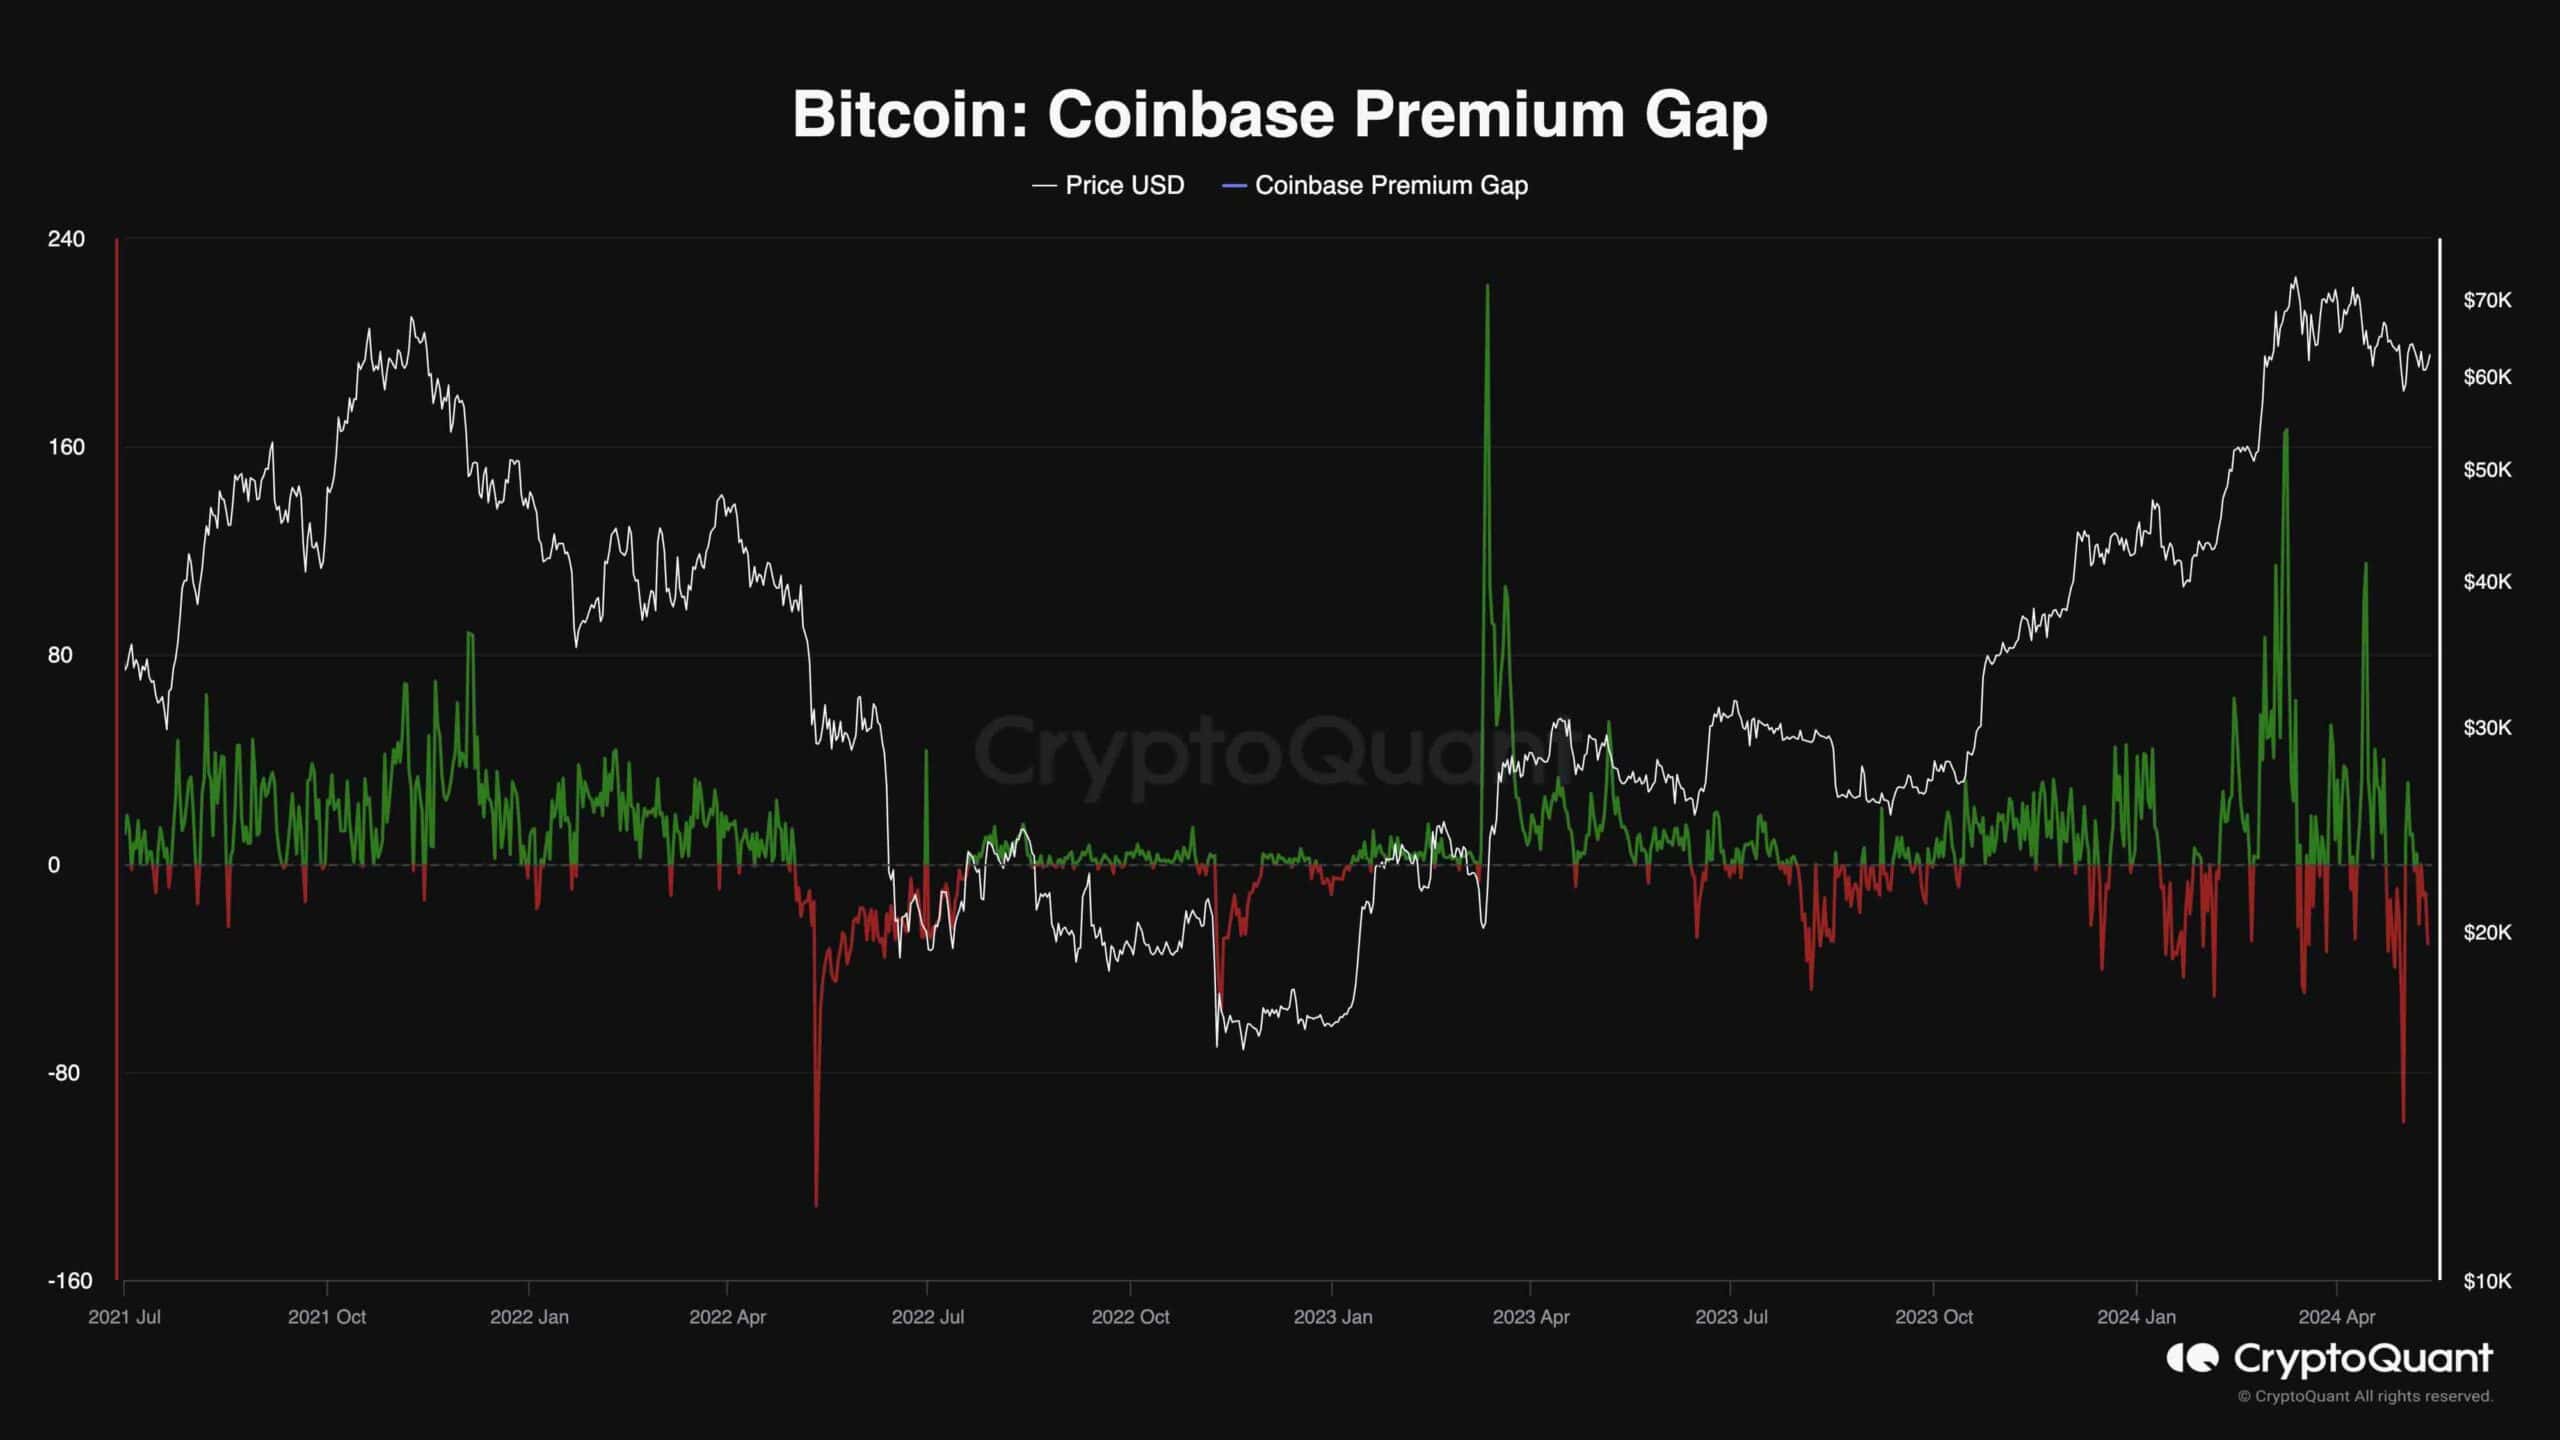
Bitcoin Coinbase Premium Gap
While Bitcoin’s price has been going through a correction over the past couple of months, everyone is looking for a culprit. Obviously, there is no single underlying reason behind the decline. Yet, looking at the US market can provide valuable insight.
This chart demonstrates the Coinbase premium gap. It measures the difference between Coinbase’s BTC/USD pair and the BTC/USDT pair on Binance. So, it basically shows a comparison of demand and supply between the US market and other countries.
It is evident that the Coinbase premium gap has been very volatile lately. Yet, the focus must be on the downside, where the metric has been showing significantly low values. This selling pressure from US investors, who are mostly wealthy individuals and institutions, is definitely one of the factors leading to the recent drop. Therefore, as long as this trend continues, there would be little hope for a bullish continuation.
The post Bitcoin Explodes Toward $63K But is the Bull Run Getting Back? (BTC Price Analysis) appeared first on CryptoPotato.