Bitcoin Exchange Balances Are At Three-Year Lows
With the bitcoin price falling below $60,000, let’s revisit the current state of exchange balances.
The below is from a recent edition of the Deep Dive, Bitcoin Magazine’s premium markets newsletter. To be among the first to receive these insights and other on-chain bitcoin market analysis straight to your inbox, subscribe now.
With bitcoin price falling below $60,000, let’s revisit the current state of exchange balances and bitcoin exchange flow activity. At a macro level, the decline in bitcoin supply on exchanges continues with the percentage of bitcoin on exchanges of circulating supply hitting another three-year low yesterday. The secular exchange balance decline that started in March 2020 has not changed.
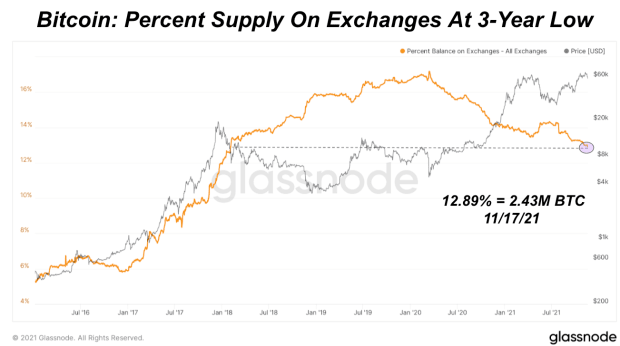
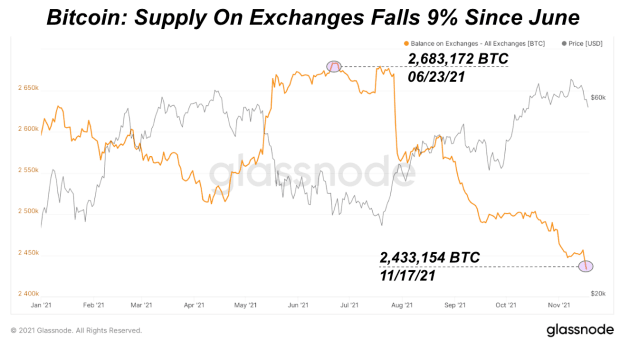
During the previous all-time high over the summer, we saw an exchange supply percentage increase as more bitcoin flowed into exchanges to sell the top. Yet, exchange balance supply has fallen 9%, over 250,000 BTC, since the June peak this year and looks like it is continuing the trend. If this were the macro cycle top, we would expect to see more bitcoin flowing into exchanges to sell.
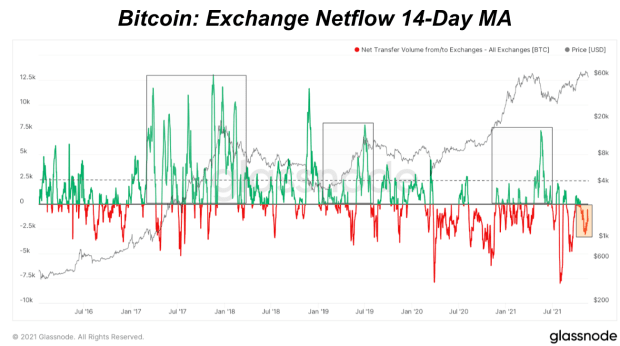
Another way to view exchange balance activity is to look at the daily net flow volume that can be inflows or outflows. Exchange wallets and addresses are classified using proprietary data science, statistics and clustering techniques from Glassnode. Generally, we want to be cautious with interpreting this data as exchange classifications are difficult to do and constantly change as exchange practices change. For example, let’s say there’s an alert that shows 10,000 BTC outflowing from an exchange on a specific day. It’s best to wait a few days for confirmation that this is not an unclassified internal exchange wallet transfer.
To account for changes in daily volume and view broader trends, we can look at a 14-day moving average of the data. When compared to all-time high runups and previous tops, we saw much higher inflow activity in the market that we’re not seeing today. If this was the macro top, we would expect to see higher exchange inflows to indicate more selling.
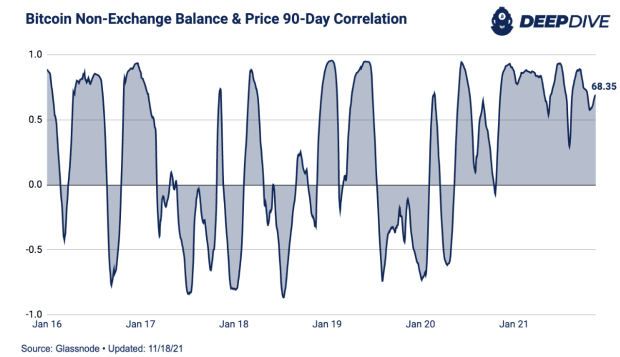
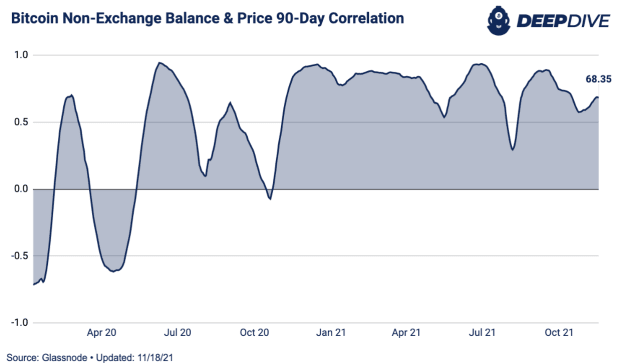
With balances on exchanges hitting new lows, non-exchange balances are rising. A couple of months after the secular market shift in March 2020, there has been a rising, sustained correlation between non-exchange balances and bitcoin price. This is a unique period compared to the last five years. It’s another way to illustrate the supply shock dynamics’ effect on price that we’ve discussed before. In bitcoin’s history, we’ve never seen bitcoin leave exchanges at this rate. Assuming that bitcoin is off the market, less supply is available to buy which puts upward pressure on price as new demand enters.
