Bitcoin Dropping to $38K Remains a Possibility, but Will the Bulls Intervene? (BTC Price Analysis)
After attempting to breach the critical resistance at $48K, Bitcoin encountered substantial selling pressure, resulting in a notable rejection and a drop to the $41K level.
However, the cryptocurrency currently seems likely to undergo a brief consolidation before embarking on its next significant move.
Technical Analysis
By Shayan
Bitcoin Price Analysis: The Daily Chart
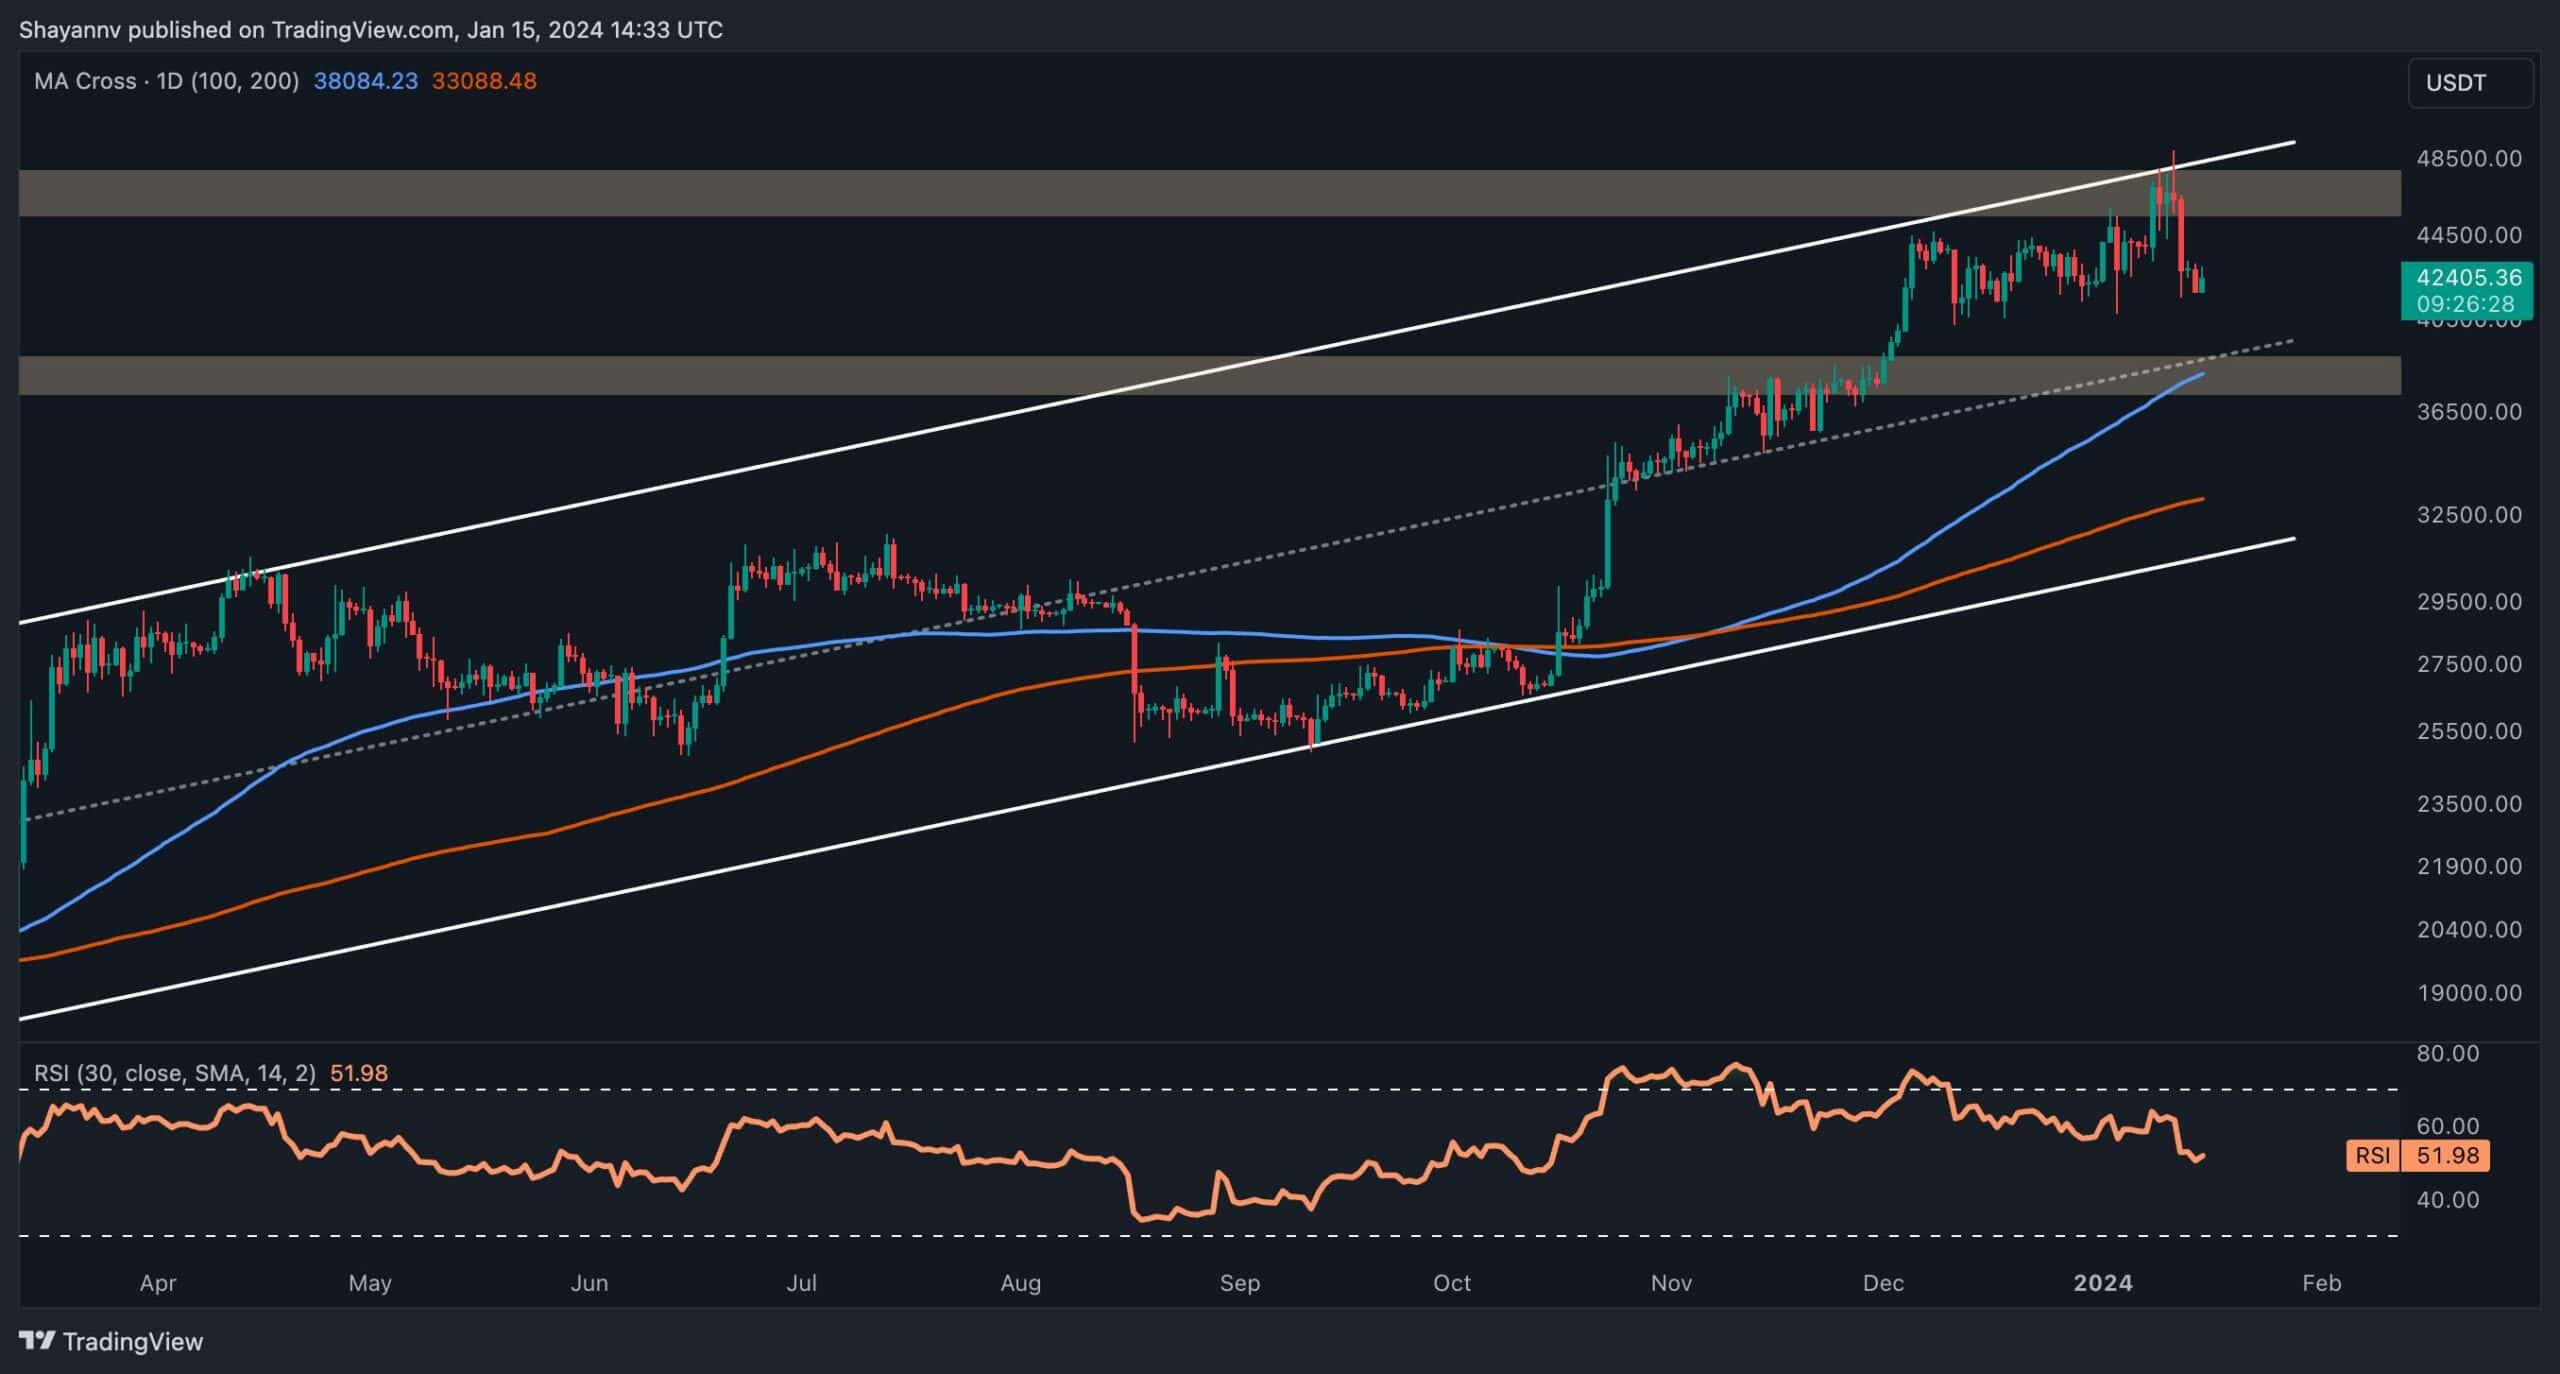
Examining the daily chart, Bitcoin’s attempt to reclaim the significant resistance at $48K faced rejection, leading to a substantial 15% decline to the crucial support at $41K. This resistance is delineated by the upper boundary of the ascending channel and the pivotal $48K threshold, acting as a robust barrier for BTC buyers.
Should the selling pressure persist and extend the retracement, a vital support zone is expected to intervene, preventing further downward movements. This area encompasses the middle trendline of the channel, coinciding with the 100-day moving average at $38K, providing a formidable barrier for sellers. Nevertheless, a consolidation phase within the $48K resistance and $38K support range is anticipated in the mid-term.
The 4-Hour Chart
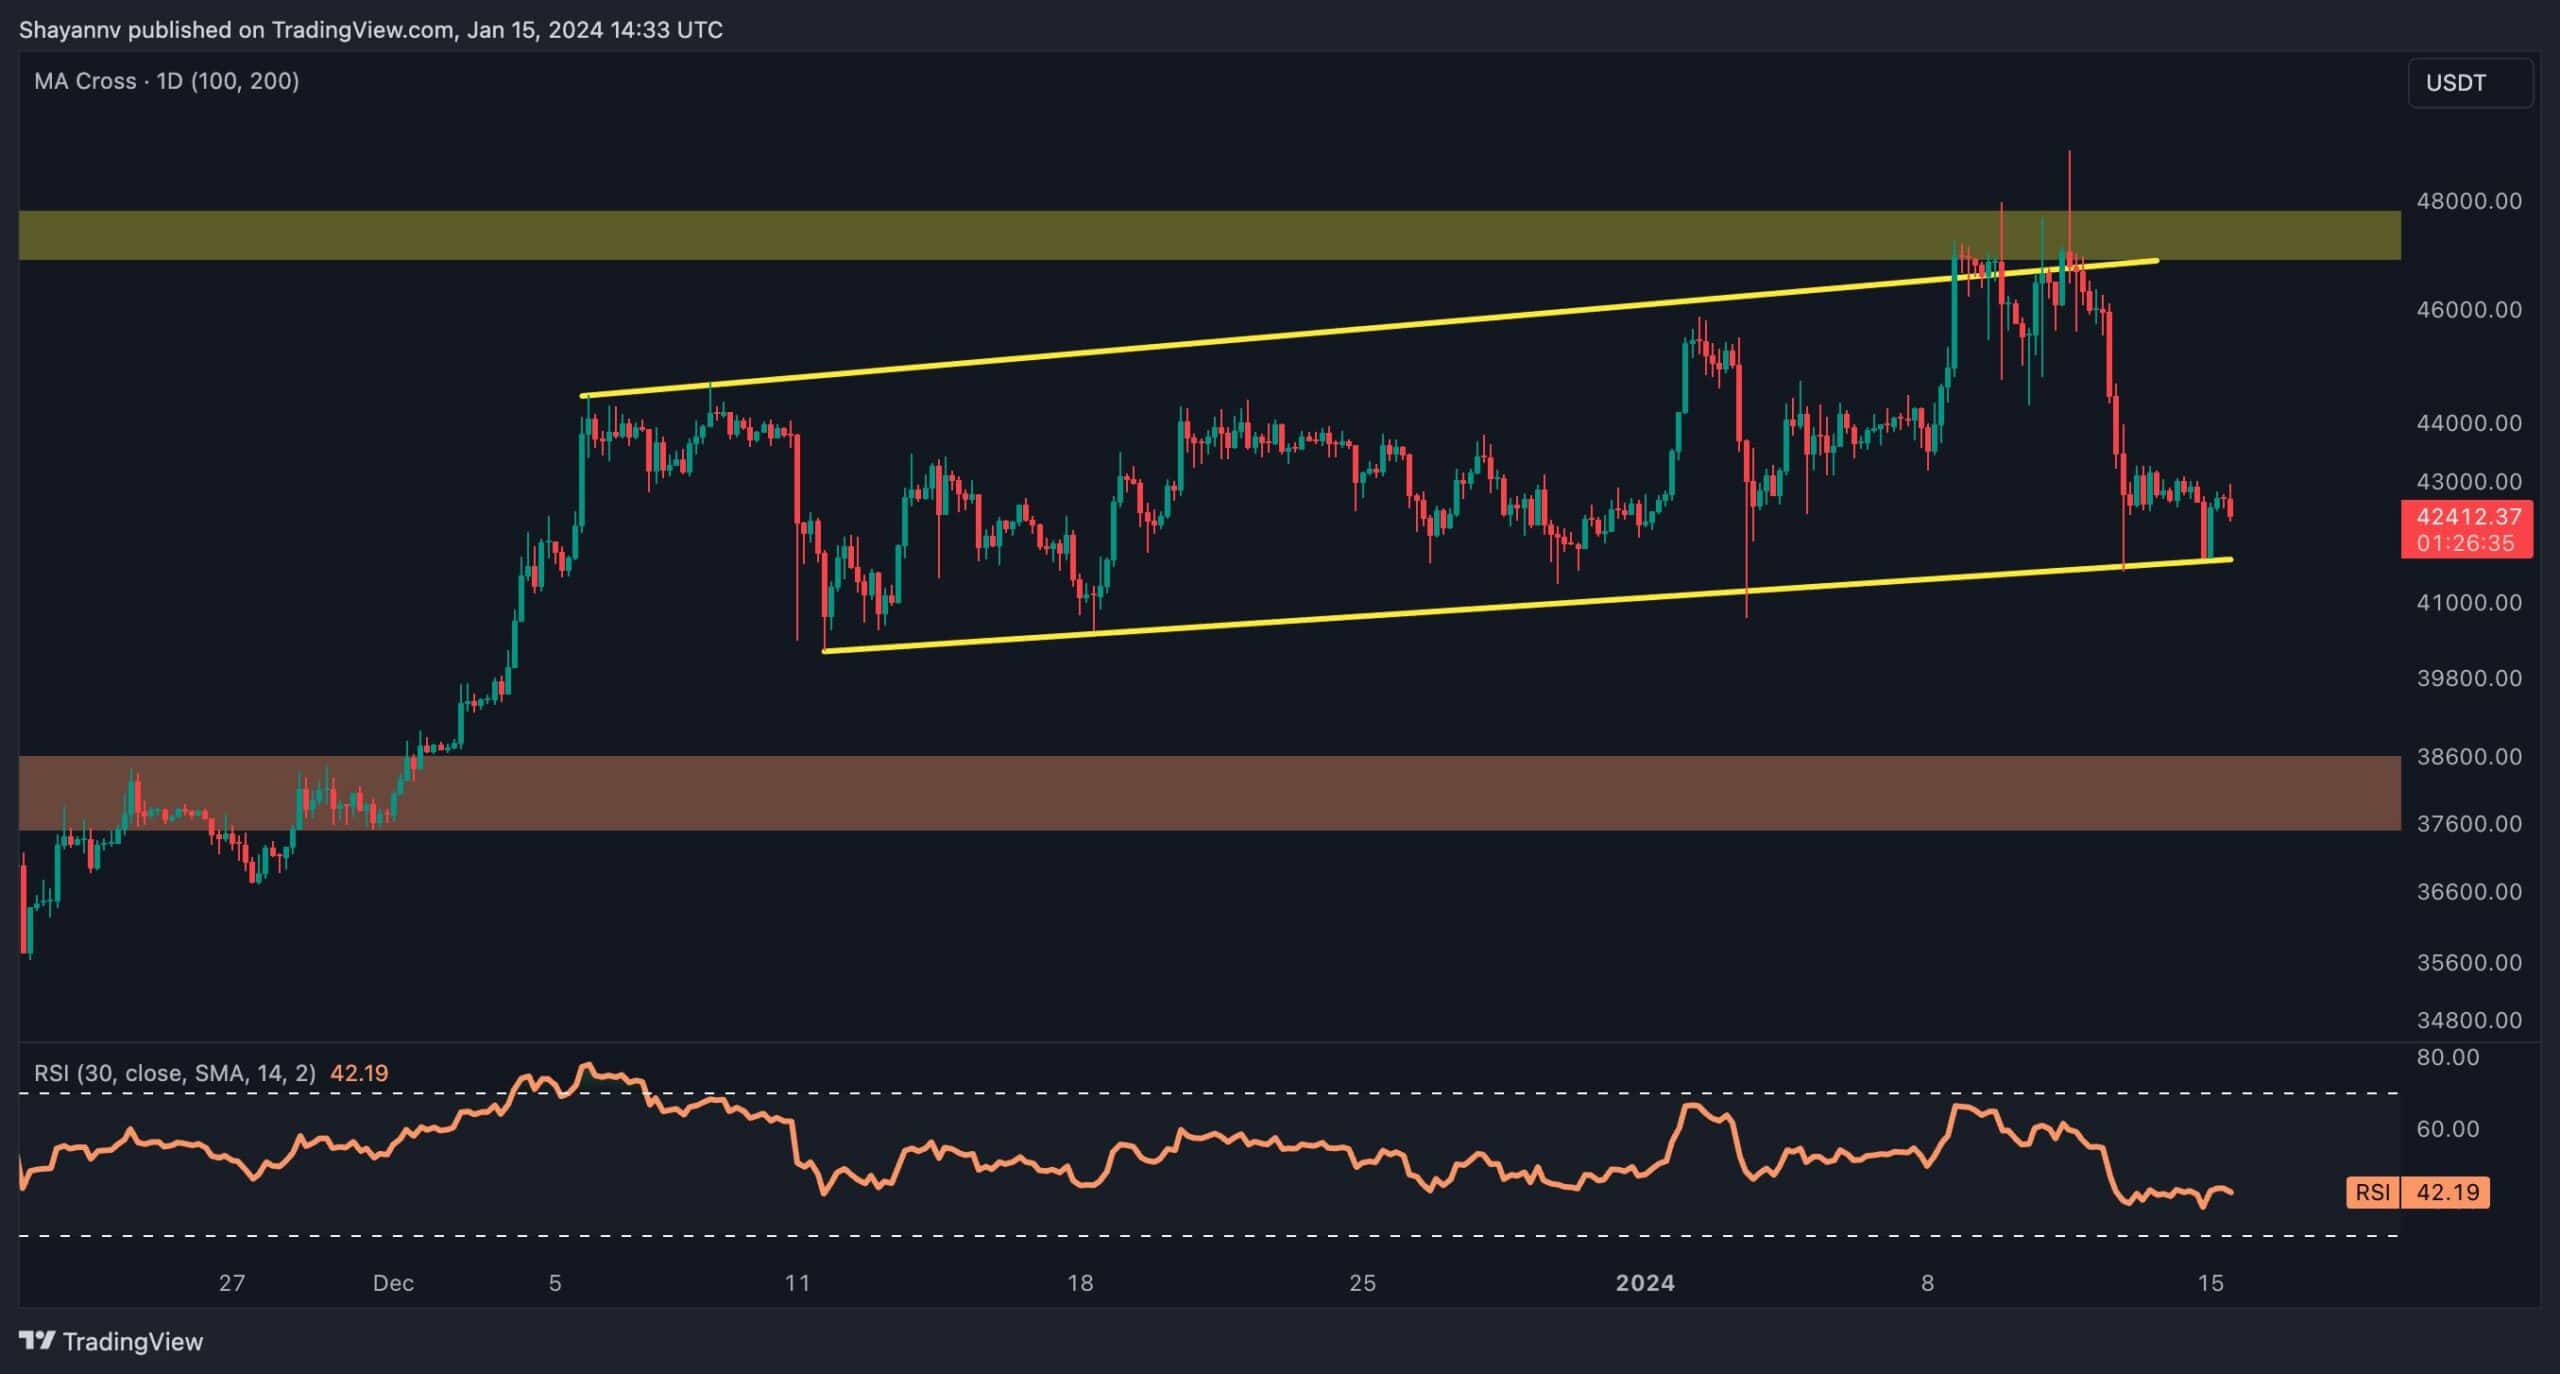
The 4-hour chart illustrates price consolidation within an ascending flag pattern, indicating a balance between sellers and buyers. Bitcoin’s recent bullish movement aiming to breach the decisive $48K resistance, aligned with the upper boundary of the ascending flag, faced increased selling pressure, triggering a cascading price drop.
At present, BTC has reached the lower boundary of the flag around the $42K support zone. A successful break below this crucial threshold, followed by a validated pullback, could pave the way for a continuation of the downtrend toward the substantial $38K support region.
However, considering the prevailing market conditions, there is also the possibility of Bitcoin entering a mid-term consolidation before initiating its next significant movement.
On-chain Analysis
By Shayan
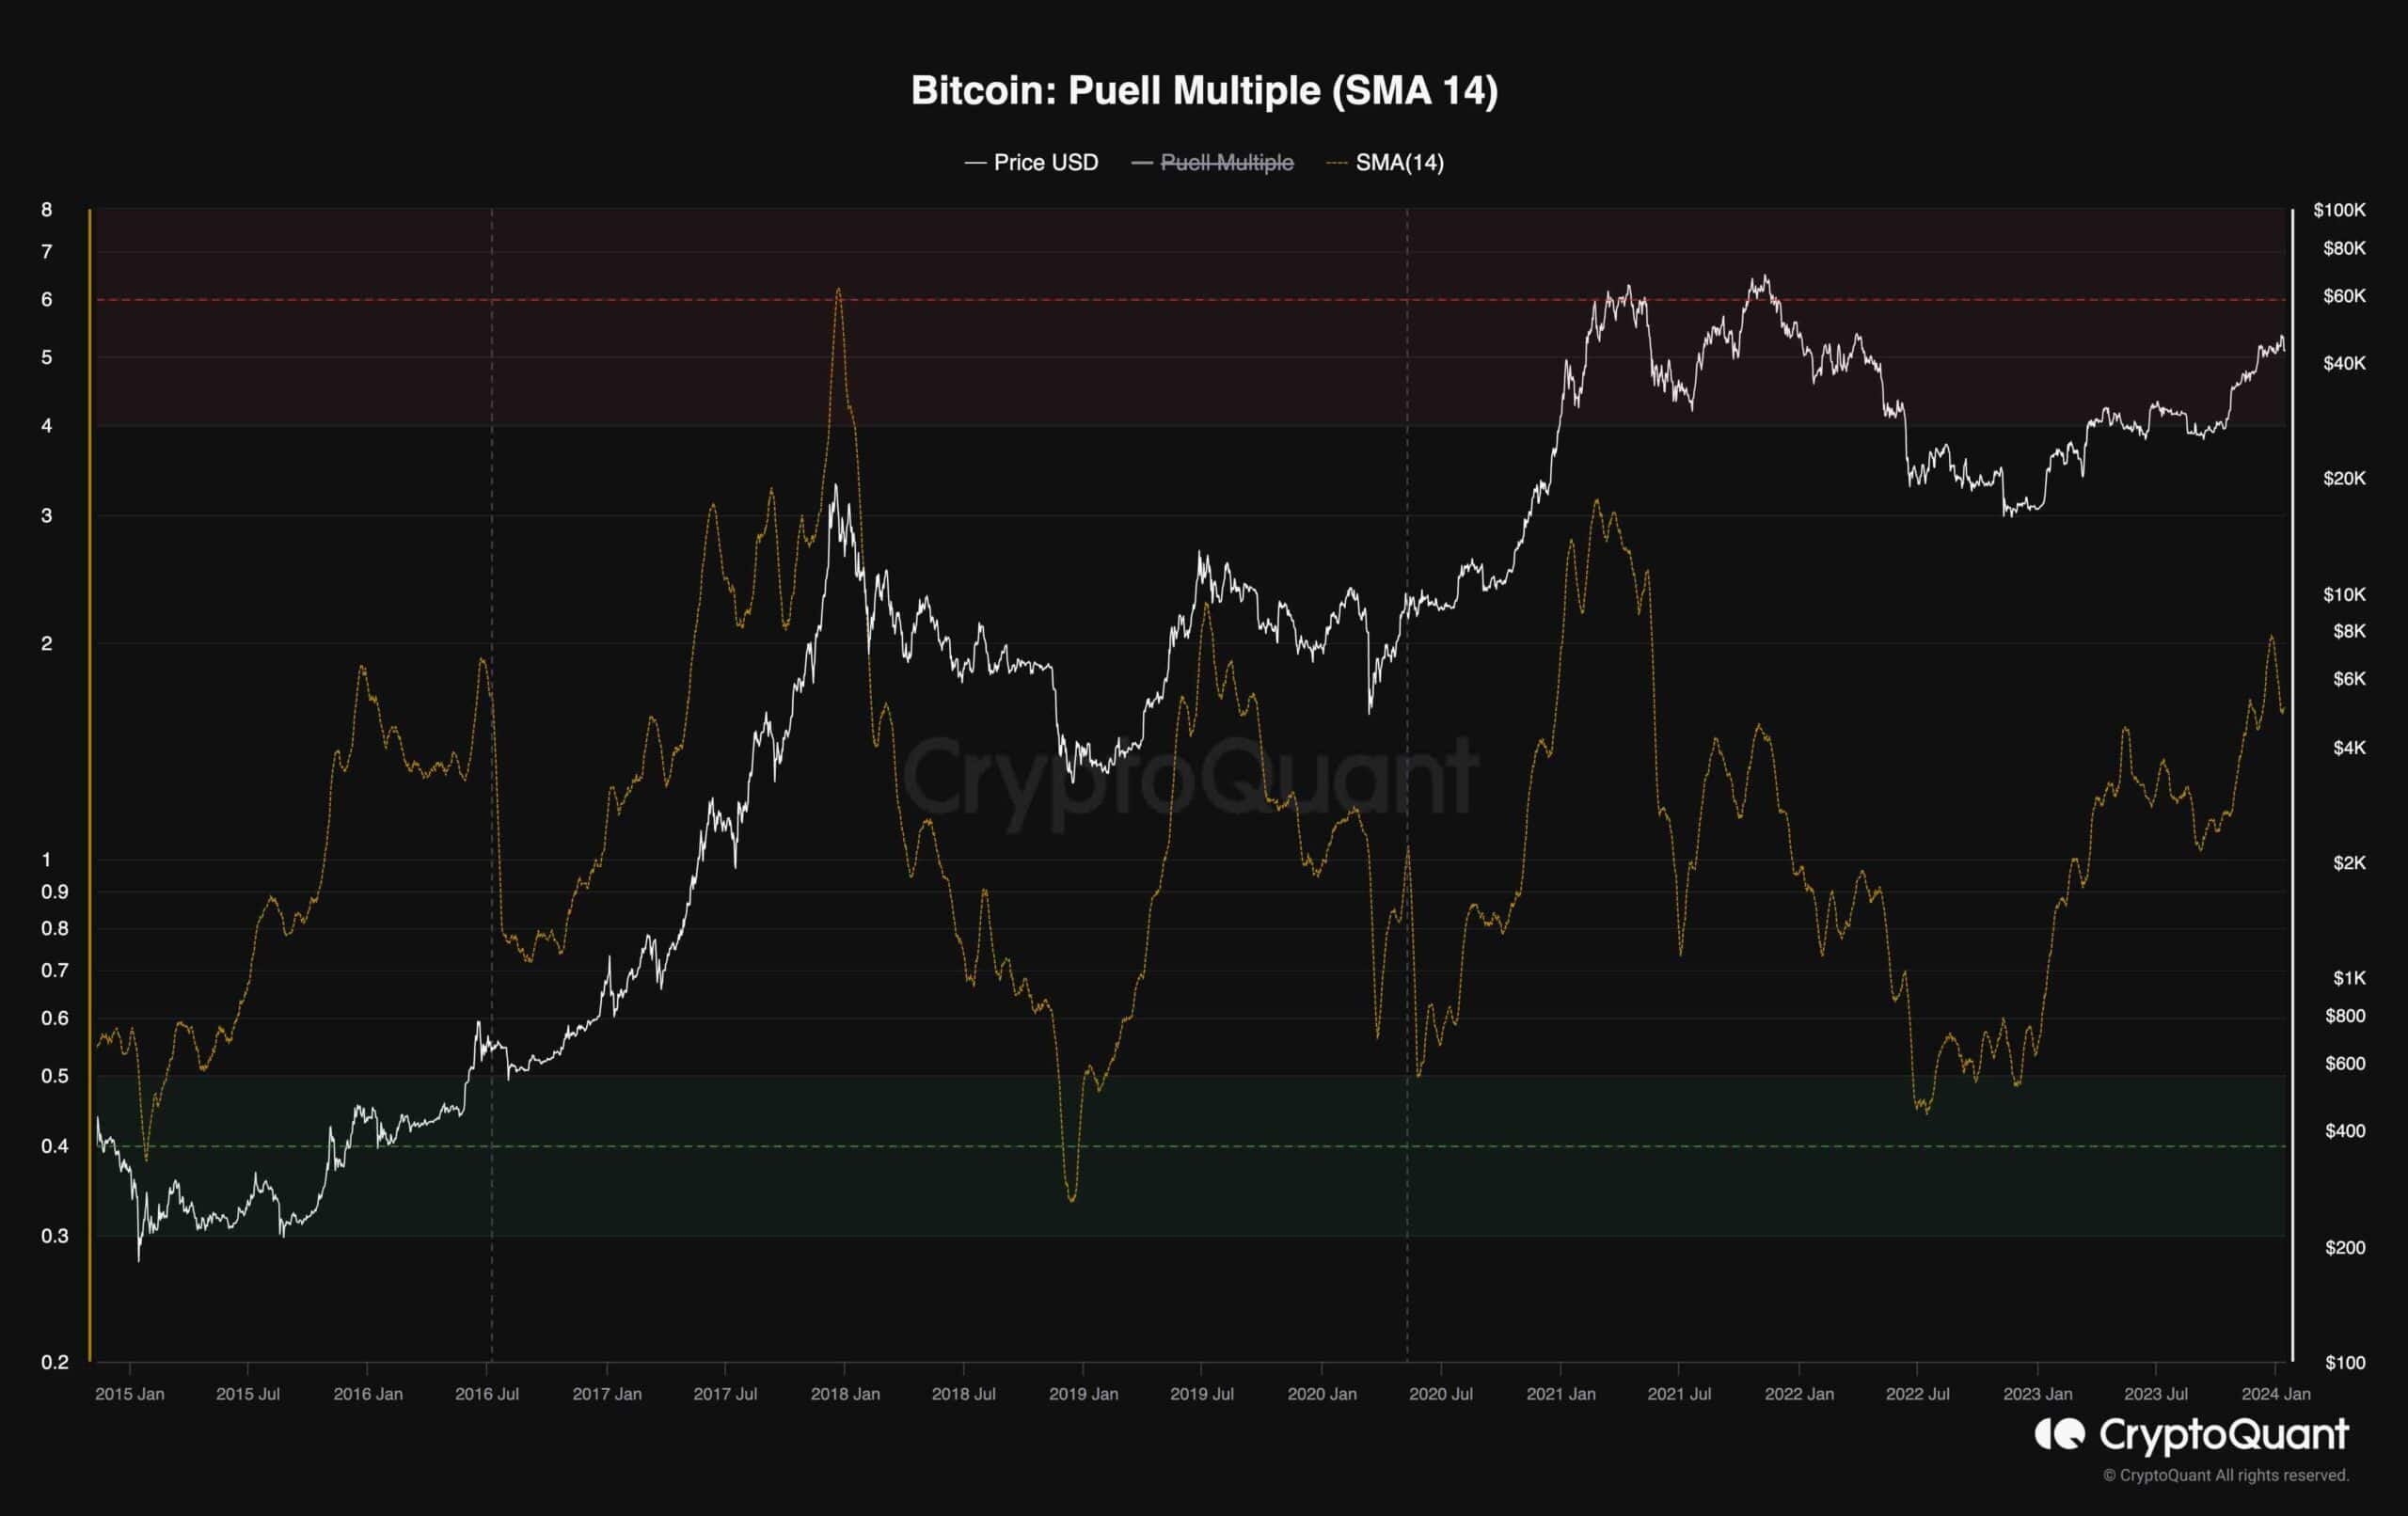
The Puell Multiple metric provides a comprehensive view of the market by assessing the profitability of mining pools compared to the past year. It poses the question: “How profitable are mining pools if all newly created Bitcoins were instantly distributed on the market?”. Historical data indicates that when the metric enters the green zone (discount region), it often signals the market’s bottom and the conclusion of bear markets. Conversely, an increase in the metric suggests profitability for mining pools, indicating a healthy and positive market condition.
As per the chart, miners’ revenue experienced a significant uptick from August 2023 until the year’s end, reaching the middle region of the Puell Multiple, with a 14-day Simple Moving Average (SMA) included. The last time this region was reached was in January 2021, when Bitcoin reached $40K for the first time. Consequently, based solely on the Puell Multiple metric, the potential return compared to risk remains favorable, as the indicator is below the intermediate region.
However, it’s essential to consider that significant capital has been in profit since the end of 2022. This factor could potentially trigger a more substantial price correction before the commencement of the next impulsive bullish trend.
The post Bitcoin Dropping to $38K Remains a Possibility, but Will the Bulls Intervene? (BTC Price Analysis) appeared first on CryptoPotato.