Bitcoin Dips Below $20K, is Another Crash Coming? (BTC Price Analysis)
Bitcoin’s price has entered a consolidation phase while its downtrend seems to have stopped after a severe shakeout to $17K. This range is likely to provide significant support, as it contains the 2017 all-time high, and it might spark a short-term rally towards the $30K region.
Technical Analysis
By Shayan
The Daily Chart
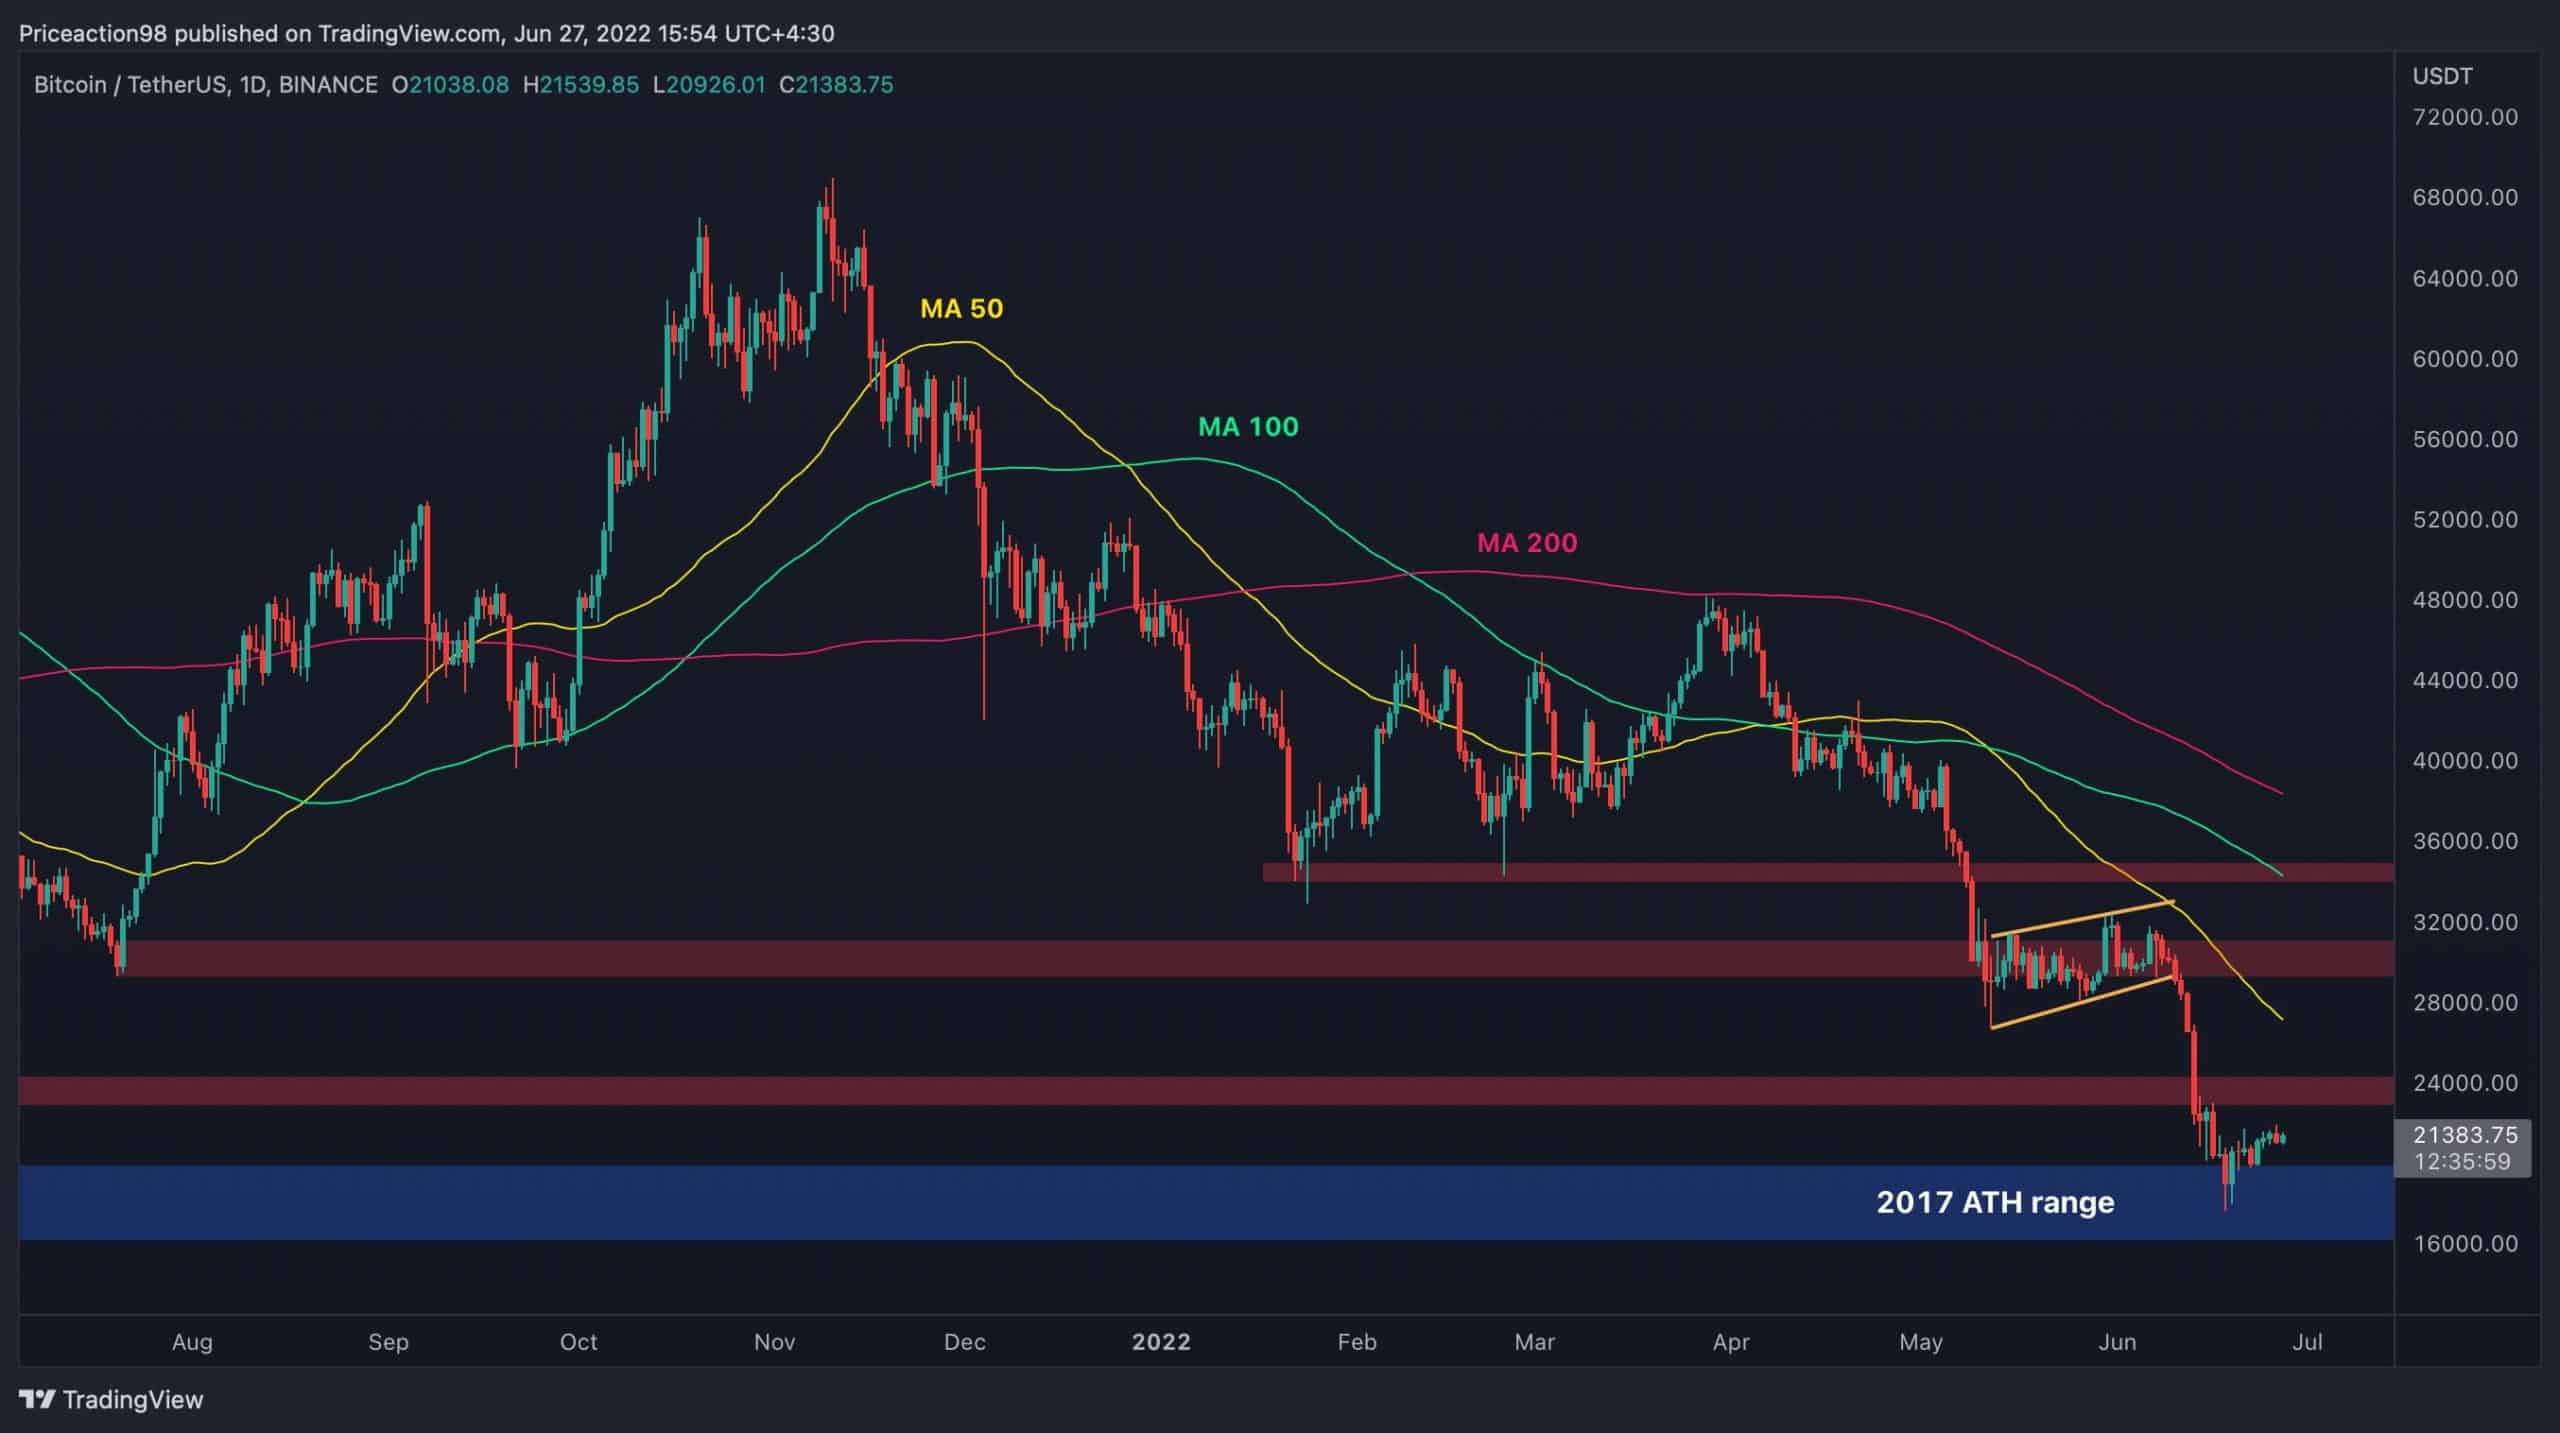
The yellow trendline has served as a mid-term resistance to Bitcoin’s price. The trendline has recently rejected the price leading to a bloodbath in the market. Nevertheless, BTC would have to break the $24K resistance level, the 50-day moving average, and the mentioned trendline before a potential retest of the $30K supply zone.

On the other hand, another steep decline might occur if the negative sentiment intensifies, driven by perpetual cascade liquidations and external forces, pushing the market below the current support level and towards the $15K mark.
The 4-Hour Chart
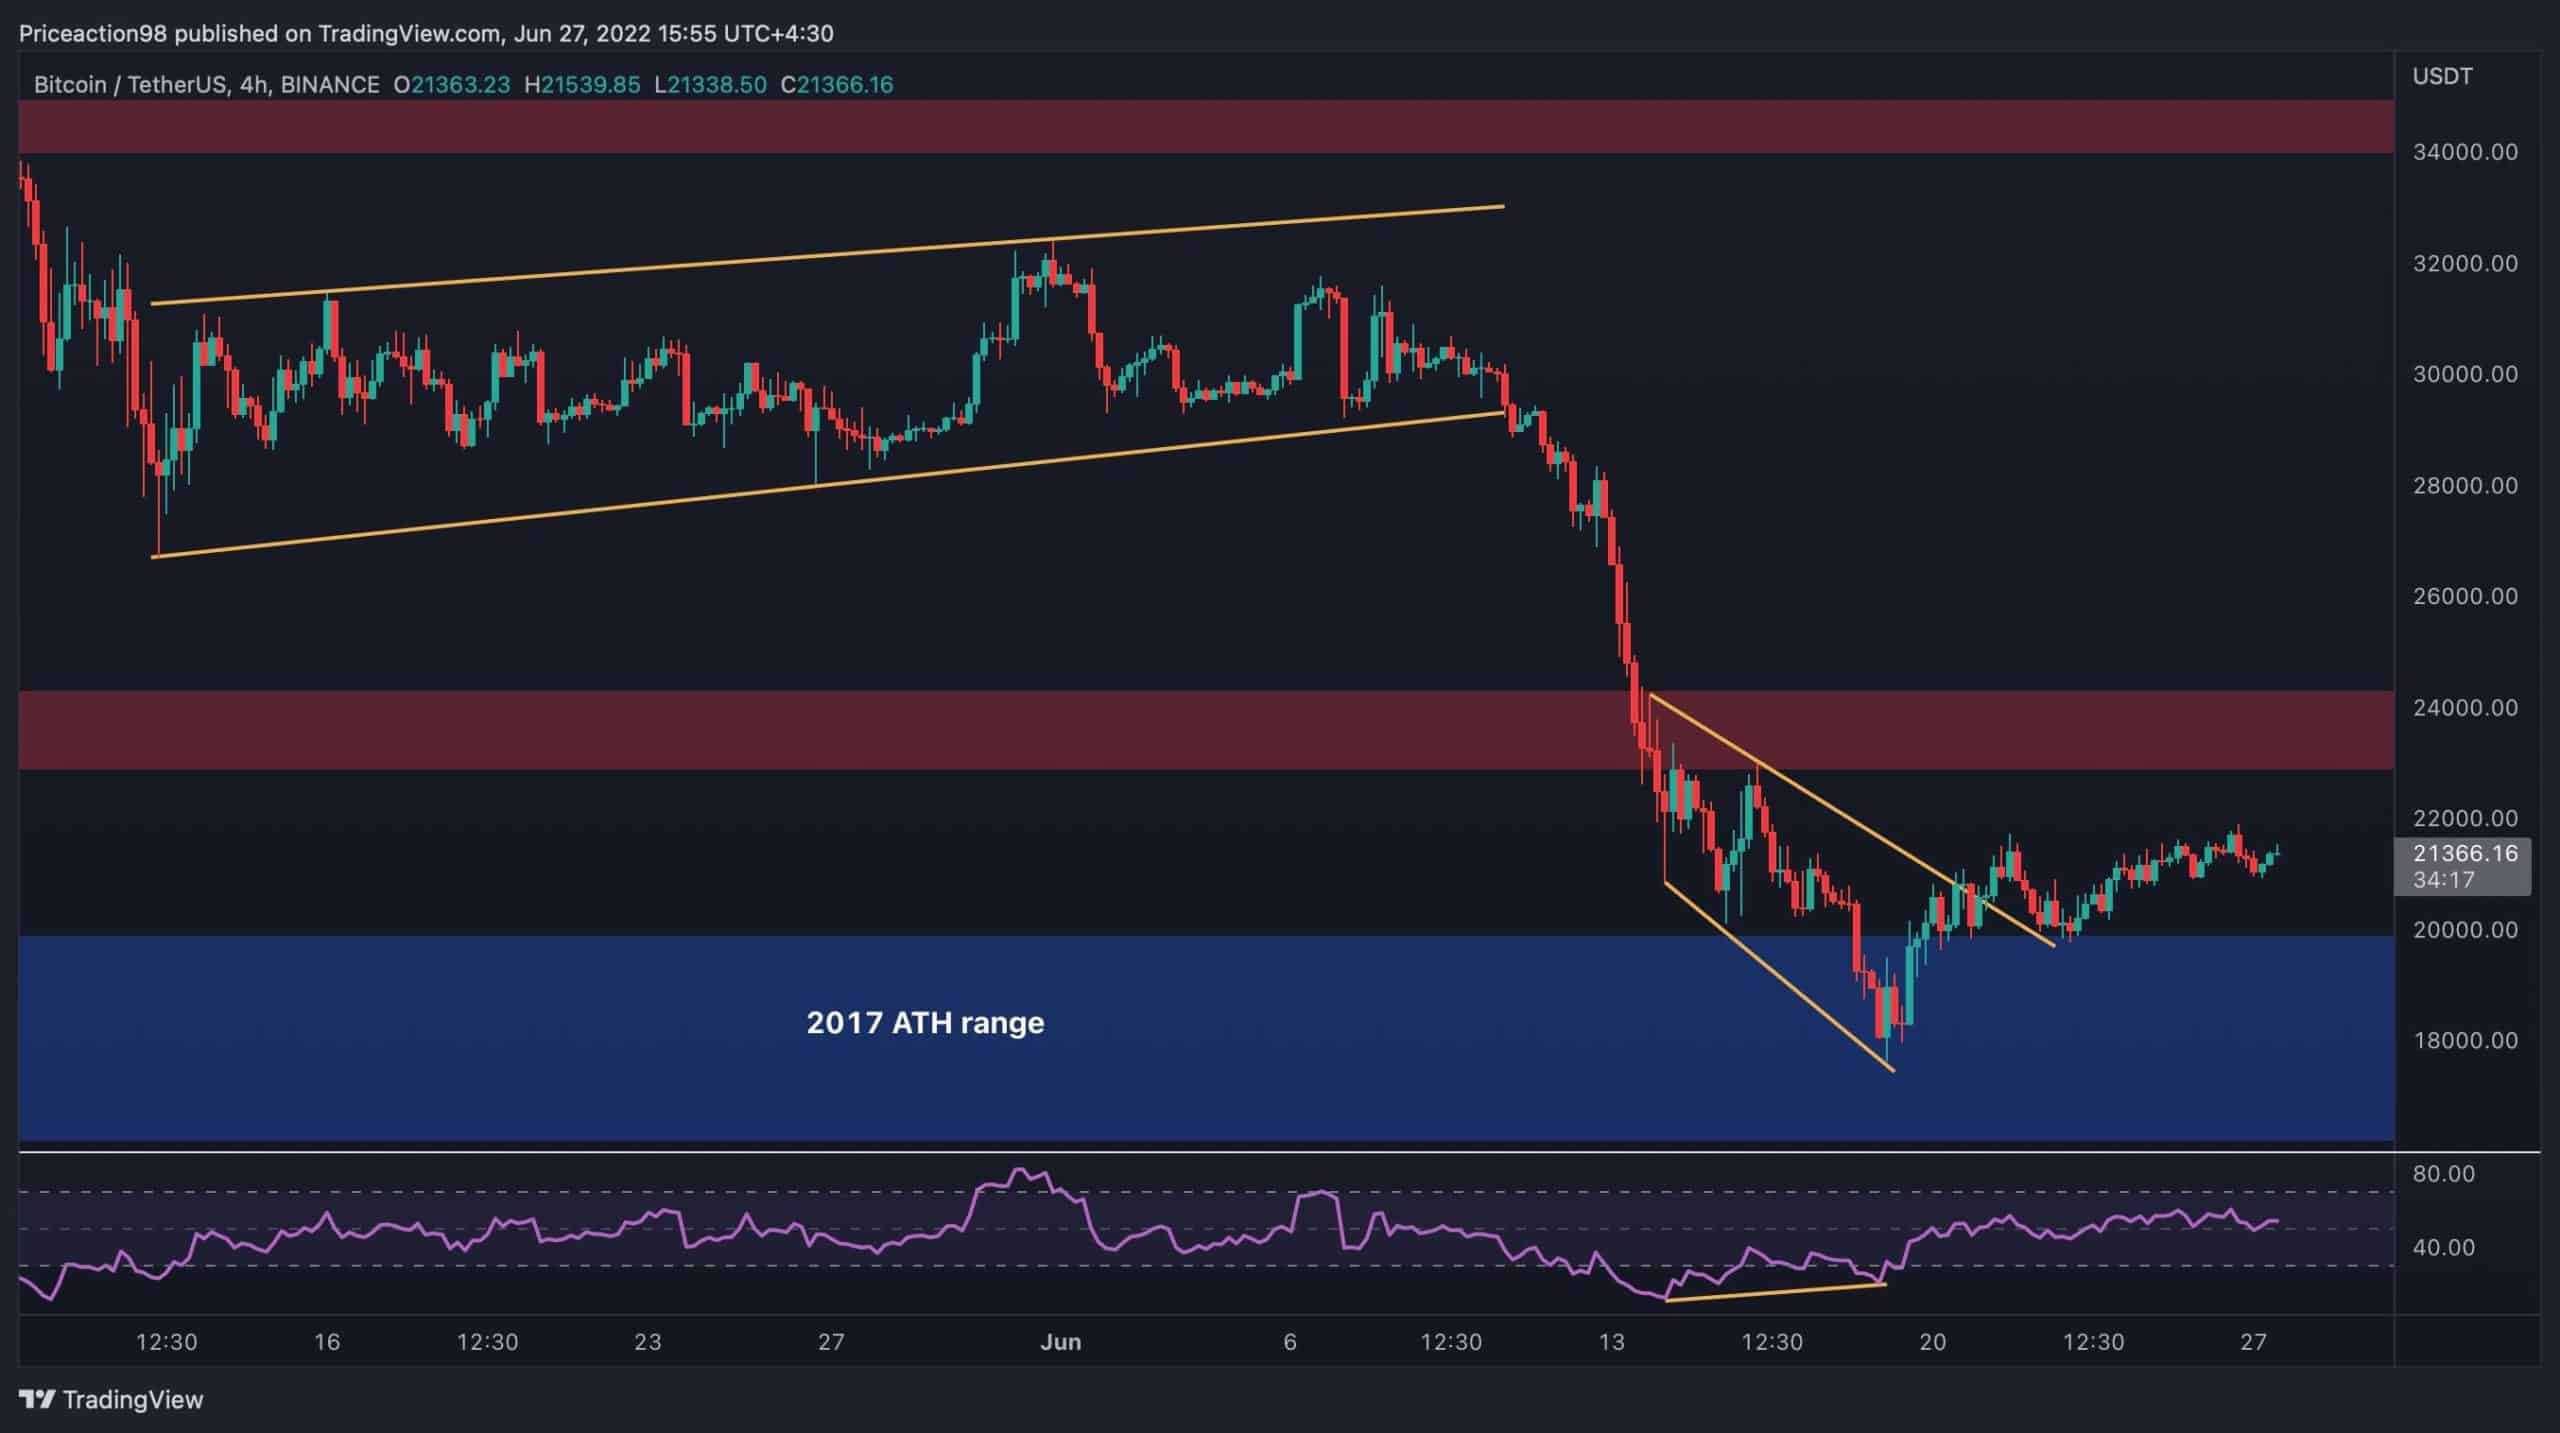
The price has been developing a bearish falling channel on the 4-hour timescale. The current bearish impulsive surge has been restrained by the channel’s bottom boundary and the primary support level at $20K.
Currently, BTC has broken the short-term descending trendline and is attempting to retest it while forming a pullback pattern. In the case of a reversal from this price level, the cryptocurrency needs to break the middle boundary and $22K to initiate a healthy rally towards the channel’s upper boundary.
However, it looks more likely that there will be a lengthy consolidation stage between the $17K and $28K critical levels before either the buyers or the sellers take the upper hand and initiate the next trend.

On-chain Analysis
By: Edris
Bitcoin Miners’ Position Index (MPI)
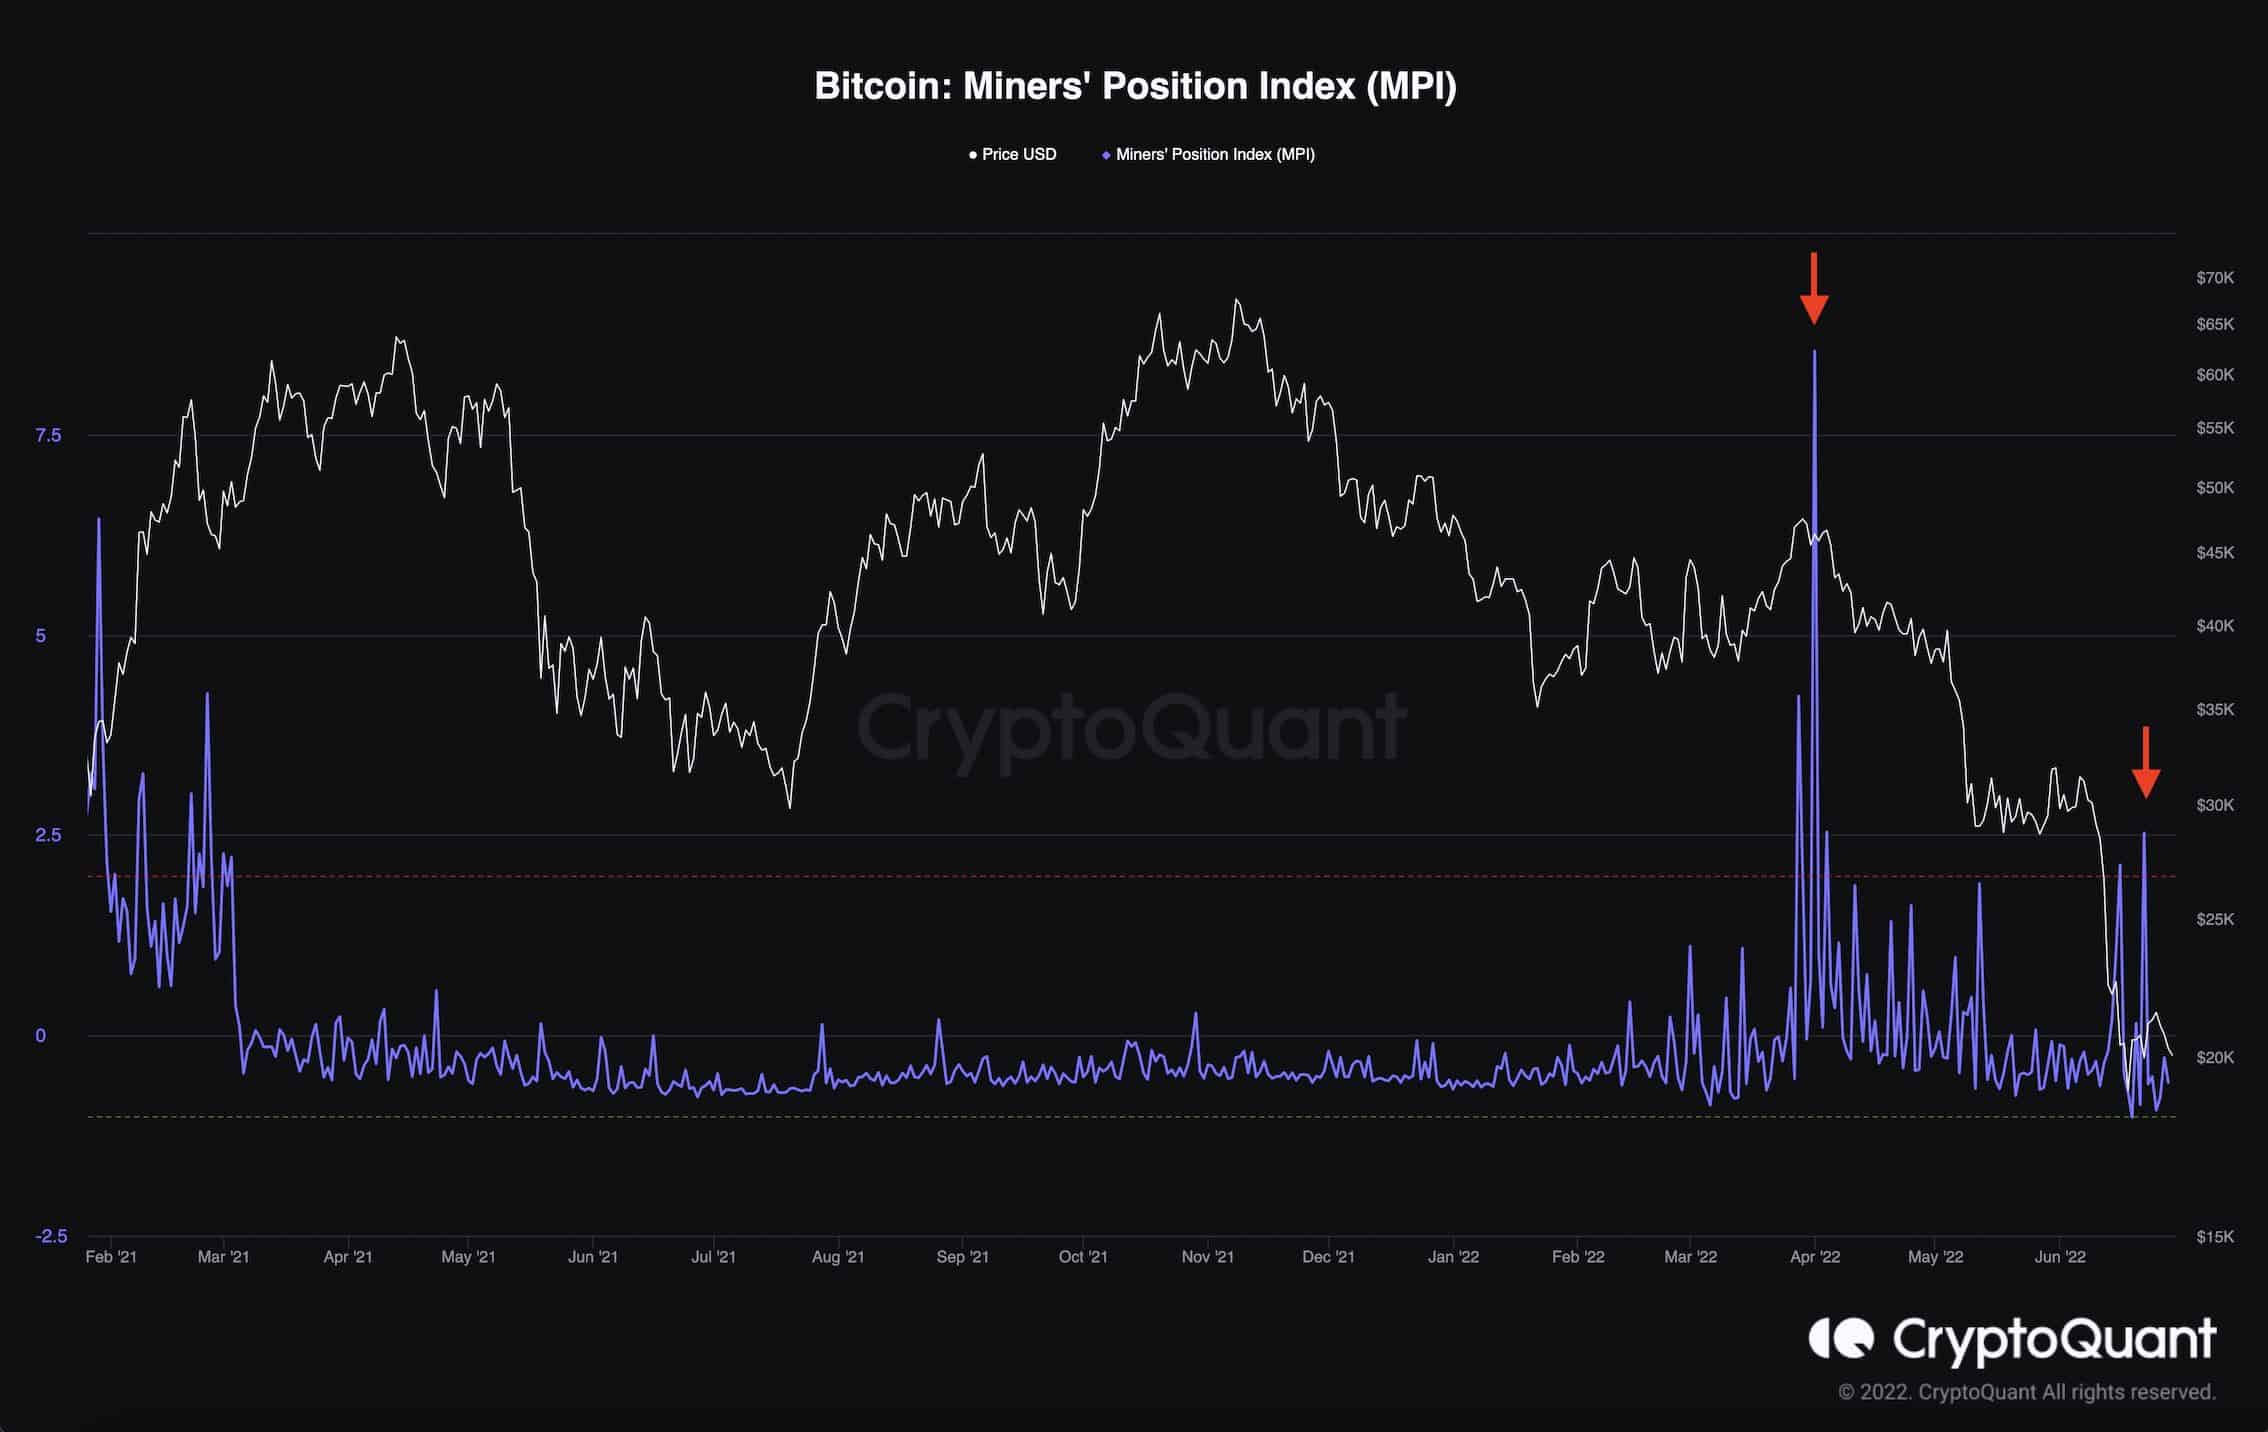
Bitcoin’s massive crash over the last few months has led to fear and capitulation of many different cohorts of market participants, and it seems that miners are not an exception.

Since the significant exodus of miners from China to North America, they have been accumulating BTC aggressively and holding on to their coins. However, many miners, who may be located elsewhere around the world, are selling their BTC in huge chunks following the recent price declines. These prompted further declines, and the substantial rise in energy prices have made mining unprofitable for some entities, leading to capitulation events. These are usually indicated by MPI values above two.


