Bitcoin Continues to Chop Inside Tight Range, Can it Hold Above $10,000? (BTC Price Analysis)
Bitcoin’s price is still whipsawing between $10,420 and $9950, as of today, despite $11 billion which were flooding back into the global crypto market over the last 48 hours.
It appears a vast majority of this new investment is pouring into Ethereum, which is enjoying a 7% daily price gain right now and is the best performing crypto-asset in the top 10 cryptos by market cap.
According to recent Skew market data, there’s even been a notable uptick in ETH futures trading volume compared to BTC, with ETH accounting for 46% of Huobi’s derivatives volumes compared to just 36% of BTC.
This flippening is almost certainly being driven by the DeFi market, which continues to attract a huge amount of attention and investment from the crypto community.
BTC Price Levels to Watch in the Short-term
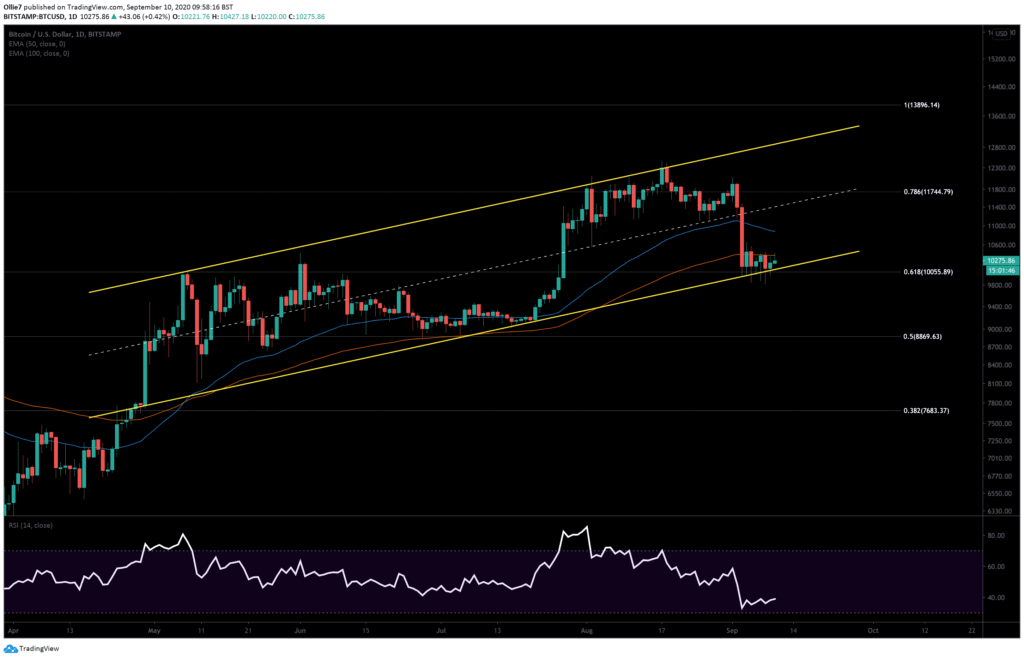
On the following daily BTC/USD chart, we can see that the price action fits very well inside a 134-day rising channel and has reacted very obviously at the median line, as well.
Right now, the price is currently resting along with the channel support, which is also reinforced by the 0.618 Fibonacci level ($10,055).
Beneath this, we can see that the long-standing daily S/R line at $9,800 that has also been tested during a brief breakout below the channel on September 8.
If prices break out beyond the channel again, we will look to the $9,800 again as the first major support before the lower CME gap level at $9,665.
Looking above, the daily 100-EMA line (red) appears to be creating some strong resistance against a breakout to the upside, at around $10,380. From there, we also have the aforementioned upper range resistance at $10,420 (red area on 4-hour chart) which bullish traders will need to overcome convincingly to stand a chance of staying above $10K throughout the rest of this week.
The 4-hour 50 EMA (blue) should also be watched as a potential area of resistance in the short-term – around $10,480- should prices break out of the range.
The Technicals
On both the 4-hour and daily BTC/USD charts, there’s a clear divergence on the RSI indicator. While Bitcoin’s price has been chopping in a mostly sideways action, the RSI indicator line has been consistently rising. This disparity suggests a trend change is imminent, and, right now, it’s favoring a move to the upside.
The 4-hour MACD is also climbing strongly towards the zero line, which suggests buying momentum is picking up.
Total market capital: $340 billion
Bitcoin market capital: $190 billion
Bitcoin dominance: 55.9%
*Data by Coingecko.
Bitstamp BTC/USD Daily Chart
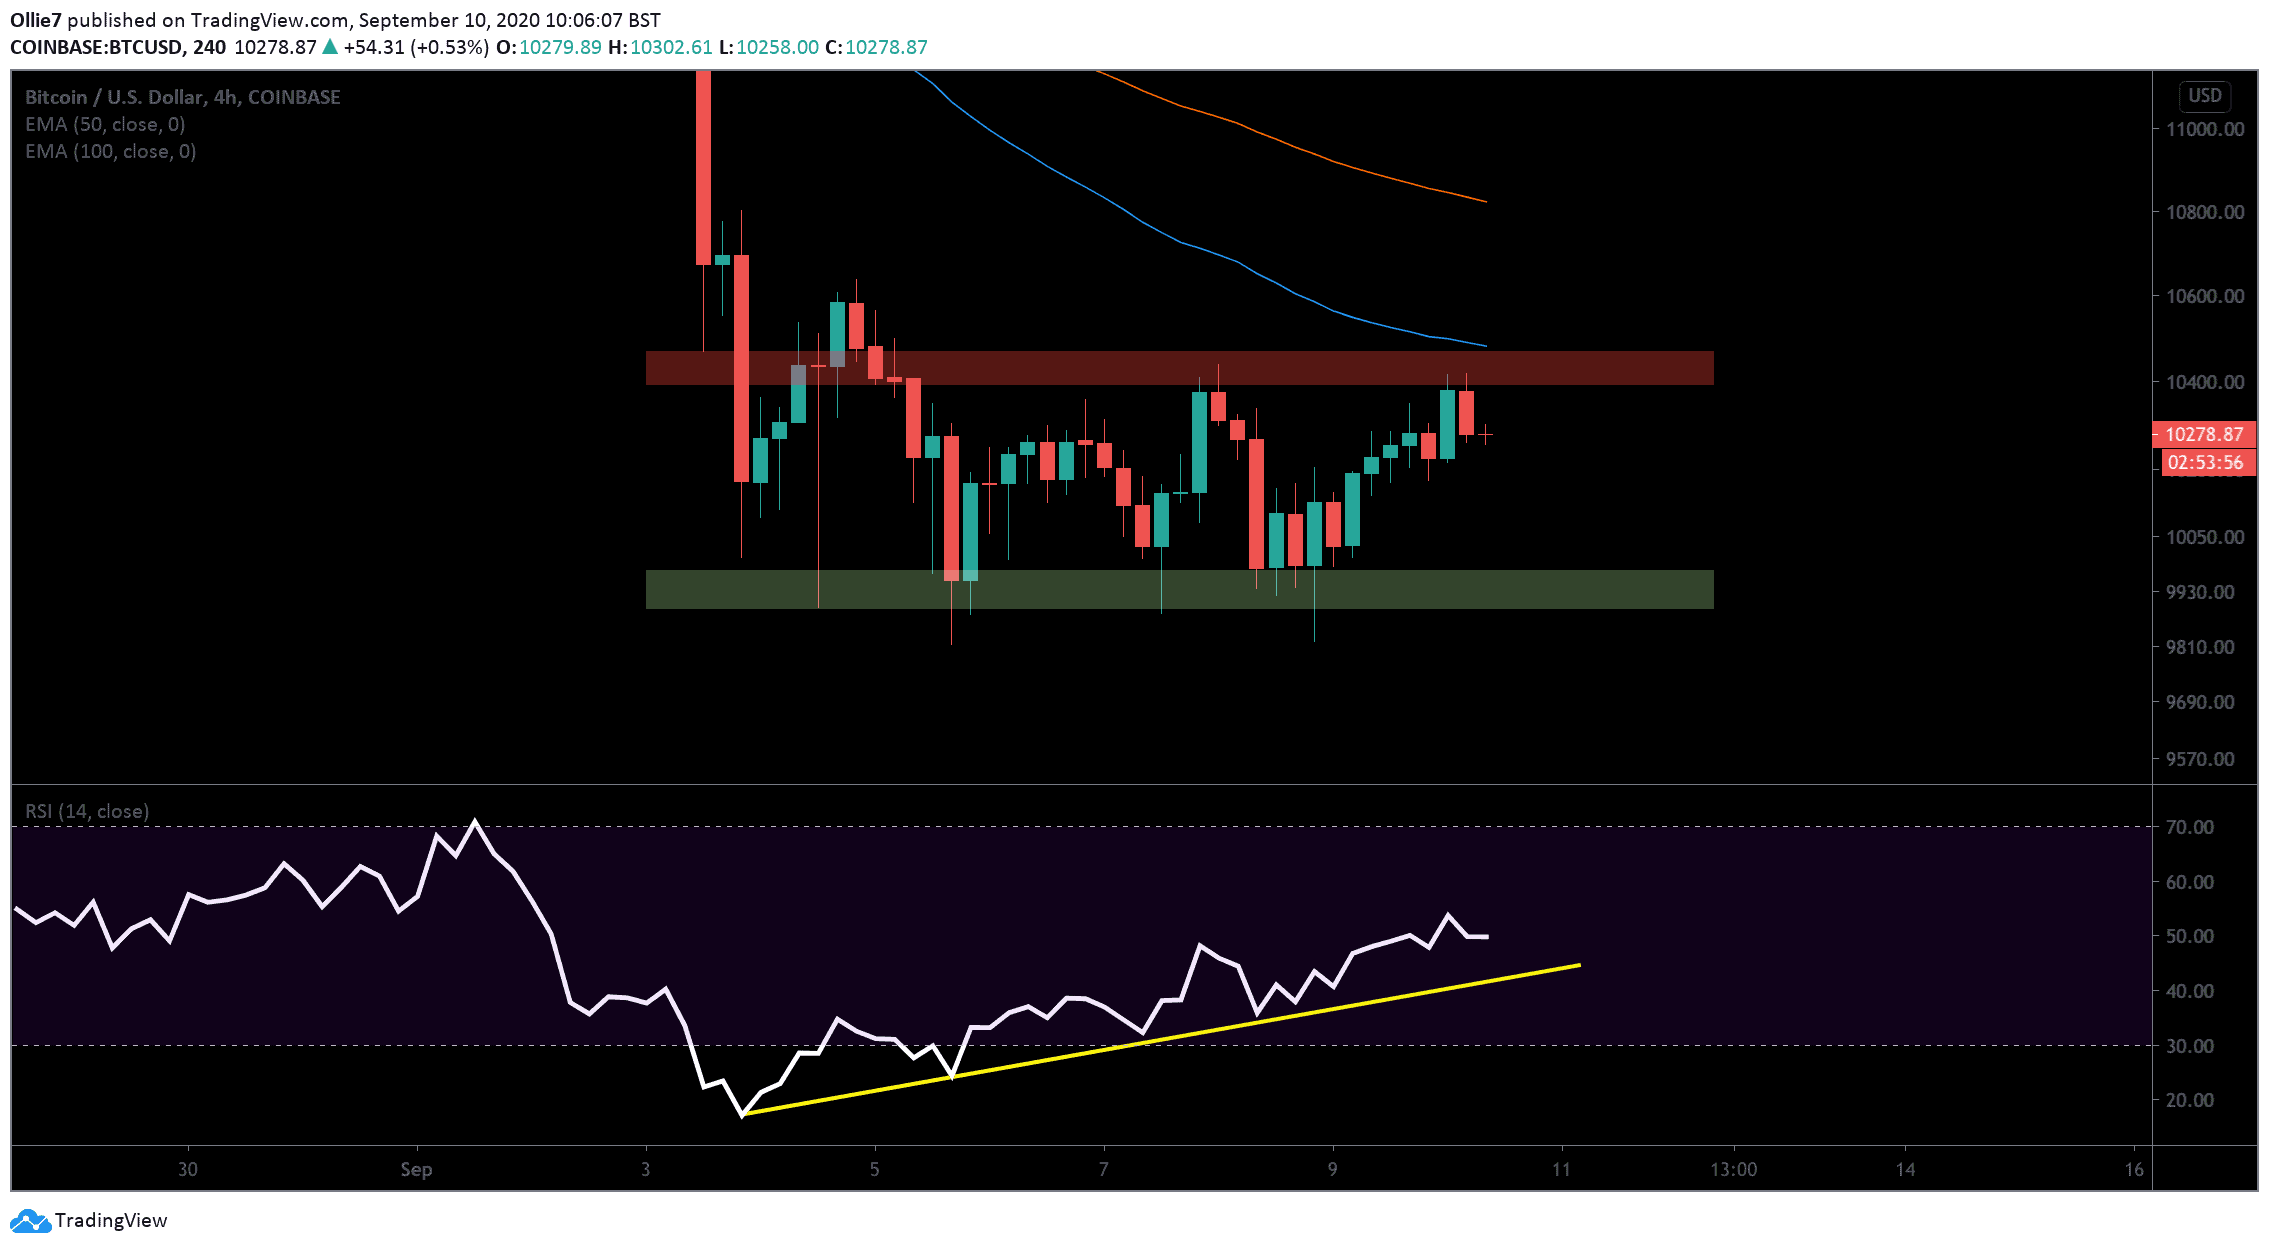
Bitstamp BTC/USD 4-Hour Chart
The post Bitcoin Continues to Chop Inside Tight Range, Can it Hold Above $10,000? (BTC Price Analysis) appeared first on CryptoPotato.