Bitcoin Consolidation Likely To End With a Huge Weekend Price Move (BTC Analysis)
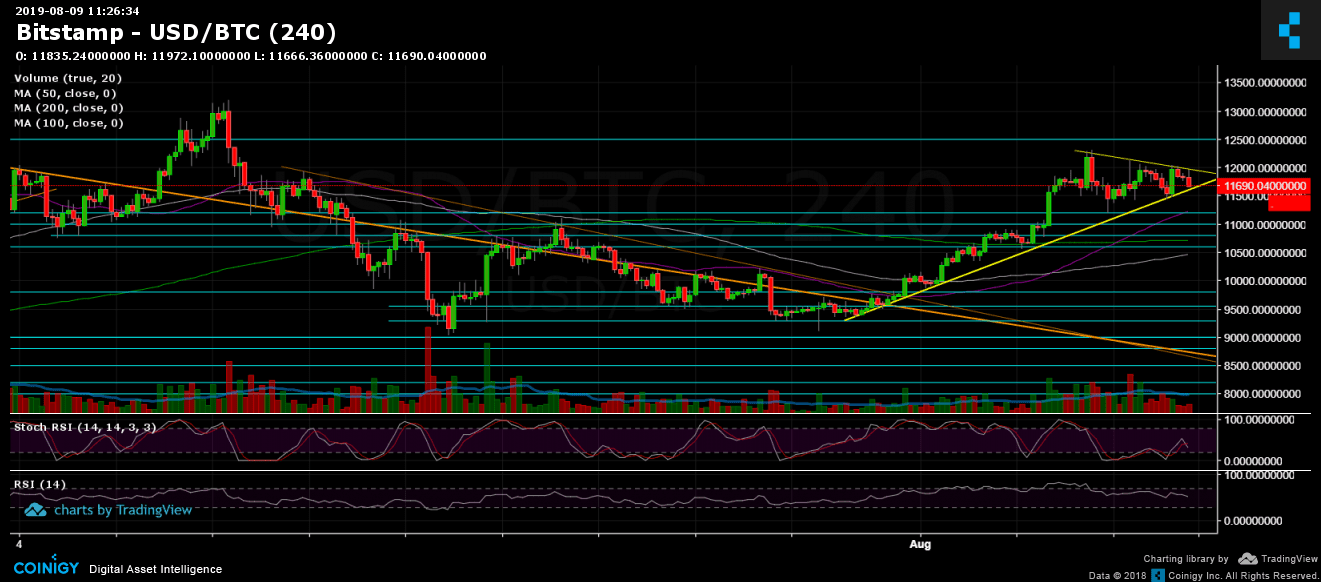
Over the past four days, Bitcoin was trading mainly between the strong demand areas of $11,500 – $11,600 to the resistance area surrounding the $12,000 region.
Looking on the following 4-hour time-frame chart, we can see that Bitcoin is forming a triangle which is likely to get breached in the next couple of hours, and end-up this short consolidation.
The fact that the weekend is coming up is another clue that a sharp move is anticipated. Over the past months, we usually see lots of Bitcoin price action during the weekends, and as stated before, this is likely because many traders are off, and it’s easier to manipulate the price.
Total Market Cap: $301 billion
Bitcoin Market Cap: $209 billion
BTC Dominance Index: 69.5% – The altcoins continue their one-way ticket to their slow death.
*Data by CoinGecko
Key Levels to Watch
– Support/Resistance:
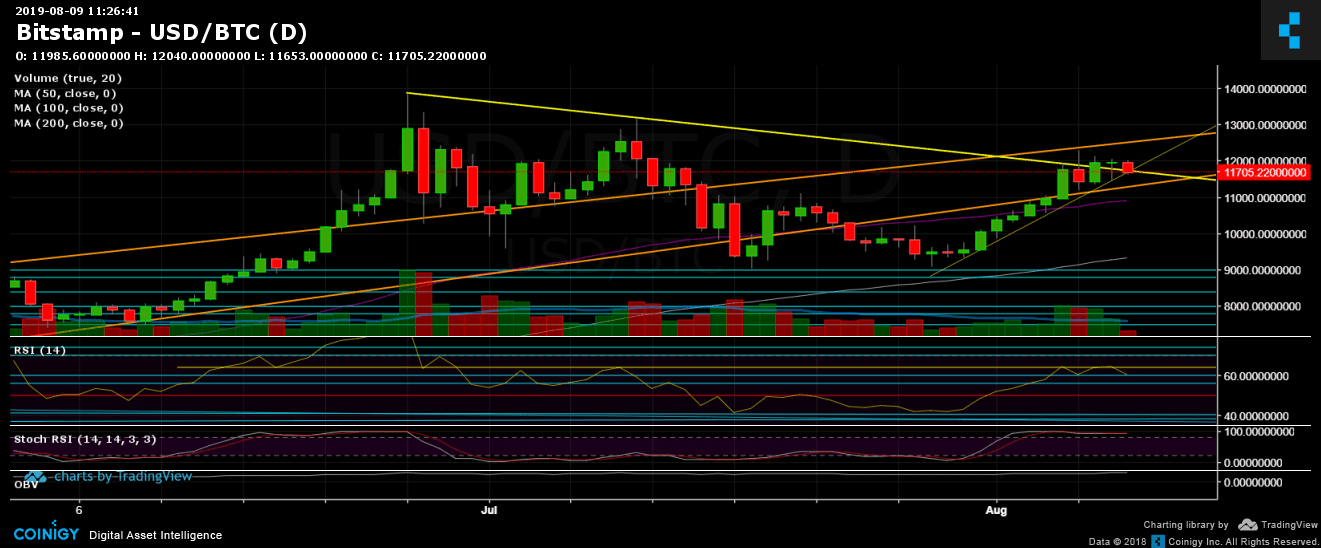
The closest support area lies nearby, at the $11,500 – $11,600 region. The last contains the mid-term ascending trend-line (the lower leg of the triangle). Further below is the $11,200 support zone, before reaching the $11,000, which contains the 50-days moving average line (marked purple on the daily chart).
From above, Bitcoin is still facing the daily chart’s yellow descending trend-line (starting from the current 2019 high), along with the $12,000 area. In case of a breakout, the next resistance areas are $12,300, before the more significant resistance level at $12,500.
– Daily chart’s RSI: After the nice surge to 64, The RSI is facing the 60-support line. As could be seen, the indicator is also hovering in a tight range (60-64).
– Trading Volume: Following the spike in volume, yesterday’s volume is back to average. In anticipation of a bigger move.
BTC/USD BitStamp 4-Hour Chart

BTC/USD BitStamp 1-Day Chart

The post Bitcoin Consolidation Likely To End With a Huge Weekend Price Move (BTC Analysis) appeared first on CryptoPotato.


