Bitcoin Cash Price Analysis: BCH Surges 13% As Bulls Get Back In Town
- BCH is one of the biggest gainers over the last 24 hours..
- Bitcoin Cash is following bullish sentiment across its trading pairs.
- Sellers are waiting to scalp gains from potential pullbacks.
BCH/USD: BCH Bounced Back After Major Corrections, Poised For More Gains
Key Support Levels: $423, $500
Key Resistance Levels: $310, $275
Since the entire crypto market recovered from the eight days correction, Bitcoin Cash has seen about a 13% increase, touching $375 on the day. As one of the biggest gainers in the past 24 hours, BCH is now trading around $367. Meanwhile, the ongoing bullish sentiment is holstered on $310 support.
BCH is currently the 4th largest cryptocurrency with a $6.69 billion market cap valuation. We can expect more gains as long as the trading volume ($4.2 billion) continues to increase.
Bitcoin Cash Price Analysis
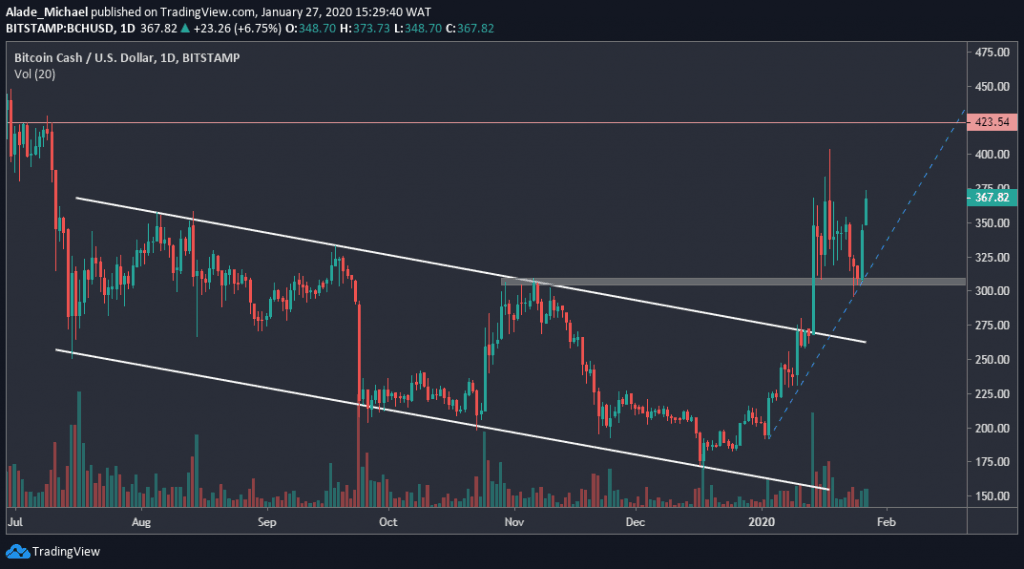
Earlier this month, Bitcoin Cash broke out of a descending channel that captured the mid-2019 bearish momentum. This breakout was characterized by a strong bullish candle that was later followed by a series of increases to hit $400 on a monthly high. After meeting rejection, BCH corrected to $295 with a pin bar candle on January 24.
Over the weekend, BCH showed strength one more time with a bullish engulfing candling, which brought a quick bounce back in the market. Today, the bullish sentiment became more significant after producing a green candle. If the buyers continue to reiterated setup, we should expect resistance at $423 before the end of this week. $500 is most likely to surface.
BCH is enjoying support on the blue-broken rising trend line. If the price drops and breaks below this diagonal support, BCH may roll back to the grey area of $310. Below this support lies $275. Regardless of the above, BCH is considered bullish against the US Dollar.
BCH/BTC: The 0.037SAT Level Reactivated Bullish Sentiment For BCH, What’s Next?
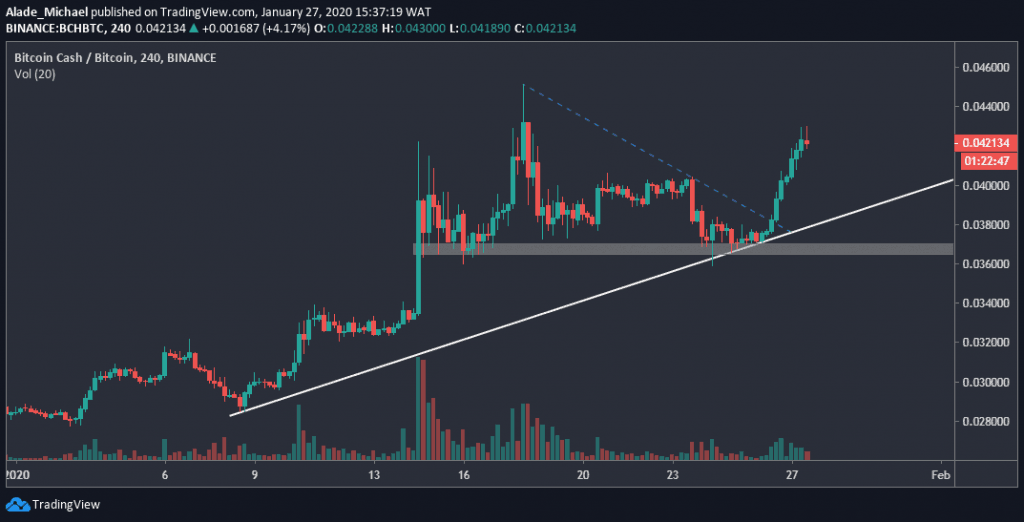
Bitcoin Cash has resumed the long-term bullish bias against Bitcoin. The breakout from last weekend restored the buyers’ hope after witnessing about 20% drops within a week. As shown on the 4-hours chart, the previous 24-hours bullish momentum was quite strong and notable.
At the time of writing, Bitcoin Cash is priced at 0.0421SAT. The latest positive move shows that the BCH volume is increasing by the day. If the buyers continue to remain active, we may see more notable gains in the next few days. Otherwise, sellers might regain control.
Bitcoin Cash Price Analysis
BCH is currently looking bullish on the 4-hours chart. As we can see, Bitcoin Cash found support around 0.037SAT level on the grey horizontal area. After regaining momentum, BCH further climbed above the blue-dotted descending line and followed by a break above the 0.0403 resistance, now support level.
More so, the current upward trend is supported by a white rising trend line that was drawn from January 8 support. At the moment, BCH is targeting 0.0451SAT level – the monthly resistance. A surge above this mentioned level could propel buying to 0.050SAT level in the coming days.
Though, the bulls seem to be getting exhausted at the moment. If BCH drops now, the support to look out for is 0.0403. However, it could bounce back on the white trend line if the price further dips.
The post Bitcoin Cash Price Analysis: BCH Surges 13% As Bulls Get Back In Town appeared first on CryptoPotato.


