Bitcoin Cash Price Analysis: BCH Follows Suit With a Strong Move to $294
- Following a steady recovery from $216, Bitcoin Cash pushed above the crucial $280 level with 25% gains in 7 days.
- Against Bitcoin, the price continues to remain in a consolidation phase after three months decline.
BCH/USD: BCH Waiting After A Slight Breakout
Key Resistance Levels: $352, $409, $428
Key Support Levels: $280, $258, $245

Following the massive surge in Bitcoin’s and Ethereum’s price, Bitcoin Cash has also seen decent growth over the past days now. BCH currently trades at around $290.
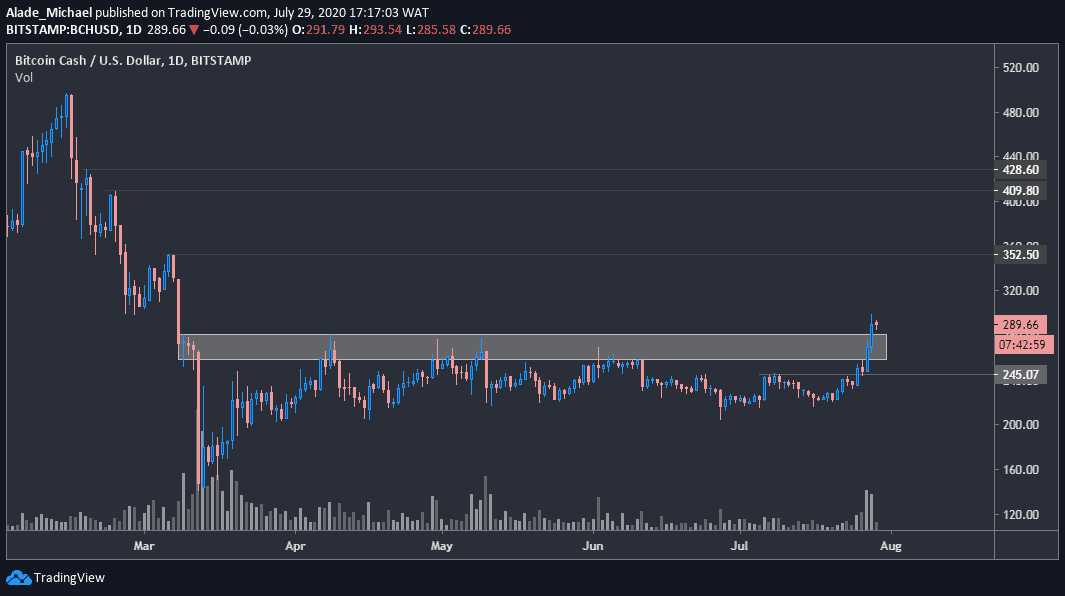
Bitcoin Cash started to show strength after pushing through $245 over the weekend with a nice break above the key supply area ($258 – $280), which suppressed bullish actions for the past four months. Considering this latest breakout to $298 (Bitstamp) yesterday, the price could see a more significant increase in the next few days.
However, the price could retest the recent break level of $280 before the buying resumes. Regardless of the above, BCH is currently setting a bullish tone on a mid-term perspective.
Bitcoin Cash Price Analysis
Looking at the current daily chart, BCH still appears cheap. However, the critical resistance to keep an eye in the next move forward is the $352 level. The following targets are $409 and $428.
In case of a drop, as said earlier above, $280 could provide a rebound level for the bulls. Otherwise, the price may slip further into the grey supply-turned-demand zone of $258. Below this area lies the $245 level that led to the latest price increase.
BCH/BTC: BCH Under Consolidation
Key Resistance Levels: 0.027 BTC, 0.0285 BTC, 0.0341 BTC
Key Support Levels: 0.024 BTC, 0.022 BTC, 0.020 BTC

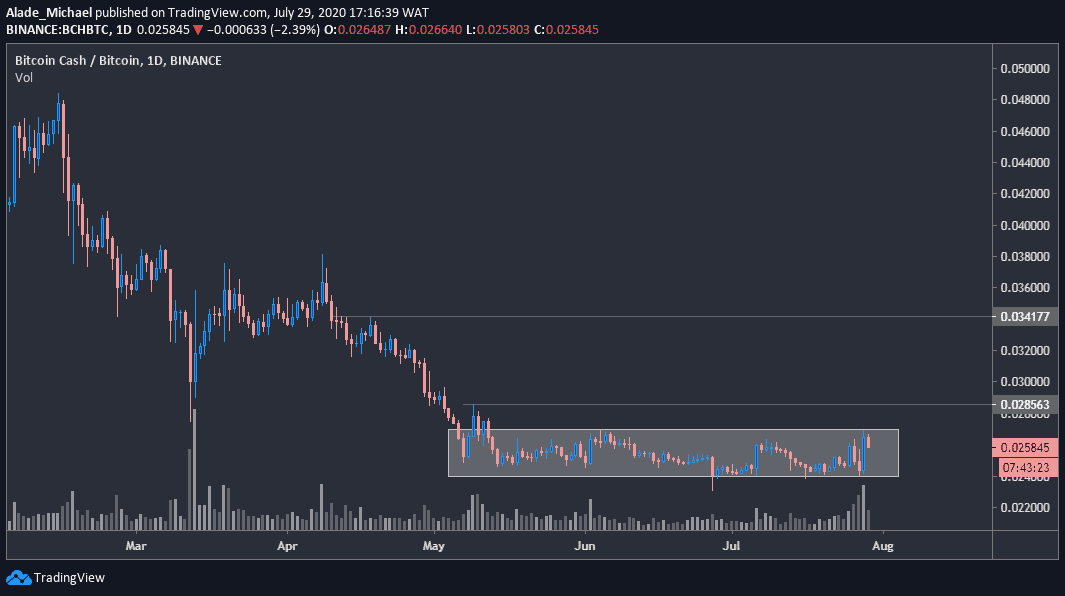
For the past two months now, Bitcoin Cash was trading within a tight range between 0.024 BTC and 0.027 BTC after plunging from 0.048 BTC in February. This consolidation cycle indicates a strong lack of interest, and the price may remain trapped in this tight range for a while.
But following yesterday’s buy-back from the 0.024 BTC level, it appeared that the bulls are showing interest again. However, it is not enough to be considered as a bullish move – a break above the 0.027 BTC level could signal a reversal for the cryptocurrency.
Looking at the current daily candle, the price is slightly dropping back towards the 0.024 SAT level. BCH currently trades at around 0.026 BTC after losing 1%.
Bitcoin Cash Price Analysis
Even if the bulls manage to push through 0.027 BTC, they would still need to breach 0.0285 BTC before advancing with a major move towards the resistance at 0.0341 BTC. Beyond that, the buyers could revisit 0.038 BTC – the point where the April selloff started from.
Meanwhile, the 0.024 BTC support is still holding as a yearly low. If a breakdown occurs, the price may collapse to a new low around 0.022 BTC or perhaps 0.02 BTC.
But for now, Bitcoin Cash is considered neutral as there’s no significant volatility to determine the next actual direction of the market.
The post Bitcoin Cash Price Analysis: BCH Follows Suit With a Strong Move to $294 appeared first on CryptoPotato.


