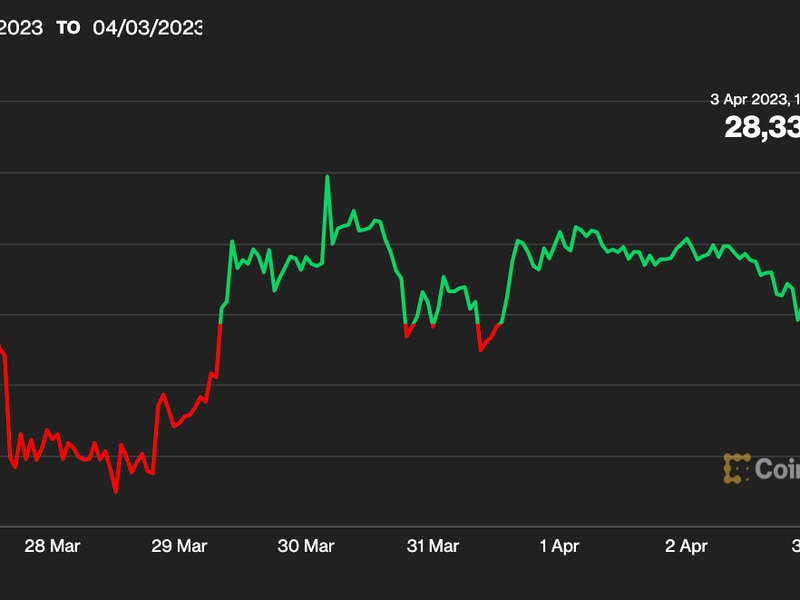
Bitcoin Bumps Up, but for How Long?
As traditional markets continue to struggle with the coronavirus crisis, cryptocurrencies are seeing an upswing in both price and volume. Now crypto traders are wondering how long this new rally will last.
Bitcoin (BTC) is up 1 percent in the past 24 hours of trading, currently changing hands at $6,224 as of 19:00 UTC. The world’s largest cryptocurrency by market capitalization may be trending below its 10-day moving average in price, but it’s still above its 50-day average, the signal of a continued upward trend.
On Coinbase, prices were as high as $6,993 on the U.S. exchange over the past 24 hours. That’s an 80 percent appreciation from its lows of $3,845 on March 12, which was hit, in part, by liquidations on BitMEX coronavirus-related news.

“We saw buying in large sizes from some larger players in the last couple of days from $5,000 and up,” said Darius Sit, managing partner of Singapore-based trading firm QCP Capital.
Over the past 24 hours, Bitfinex traded on its spot markets more than $400 million worth of cryptocurrencies, according to the exchange. This coincided with a price spread developing and arbitrage opportunities forming on exchanges like Bitfinex and BitMEX.
Bitfinex CTO Paolo Ardoino told CoinDesk the action comes from “a combination of multiple factors [including] halving, hedging against the traditional market and an important number of fiat inflows entering crypto markets to take advantage of the recent decline.”
With the potential of government stimulus plans boosting economic activity, bitcoin has been very bullish.
So where is bitcoin’s price going? Professional stakeholders, as usual, differ on opinions and strategies.

“Conditions look set for a stellar rise with unprecedented monetary easing and fiscal stimulus along with the halving narrative. So once there was a sense of some stabilization in the spread of the virus (0 cases in China yesterday) a frenzy of buying occurred,” QCP Capital’s Sit told CoinDesk.
“In terms of the recent recovery, if the trend will continue the next resistance will be around $7,200,” said Constantine Kogan, a partner at crypto fund of funds BitBull Capital.
However, Kogan also noted a lot might happen on a fundamental level with the coronavirus epidemic and subsequent market reaction. Both the S&P 500 index and bitcoin volatility are jumping to dramatic highs.
“Seems like markets are having their relief rallies after a destructive week,” said Michael van de Poppe, an Amsterdam-based cryptocurrency trader. “So far I think it’s a bearish retest and we’ve got to test $5,500-$5,800 and perhaps $4,200-$4,400”
The Nikkei 225 ended its trading session down a percent, while the FTSE 100 index in Europe closed up 1.5 percent. As of 19:00 UTC, the S&P 500 is down over 3 percent while gold is eking out less than a percent gain.
Other top gainers in the crypto market today as of 19:00 UTC include dash (DASH) also in the green 9 percent Zcash (ZEC) up 5 percent and bitcoin SV (BSV) gaining 1 percent,. Downward pricing dogs in crypto include cardano (ADA) down 4 percent, NEM (NEM) also in the red 2 percent and IOTA (IOTA) down 4 percent.
Disclosure Read More
The leader in blockchain news, CoinDesk is a media outlet that strives for the highest journalistic standards and abides by a strict set of editorial policies. CoinDesk is an independent operating subsidiary of Digital Currency Group, which invests in cryptocurrencies and blockchain startups.


