Bitcoin Breaks Down to Dec-20 Lows, Here are The Critical Levels to Watch (BTC Price Analysis)
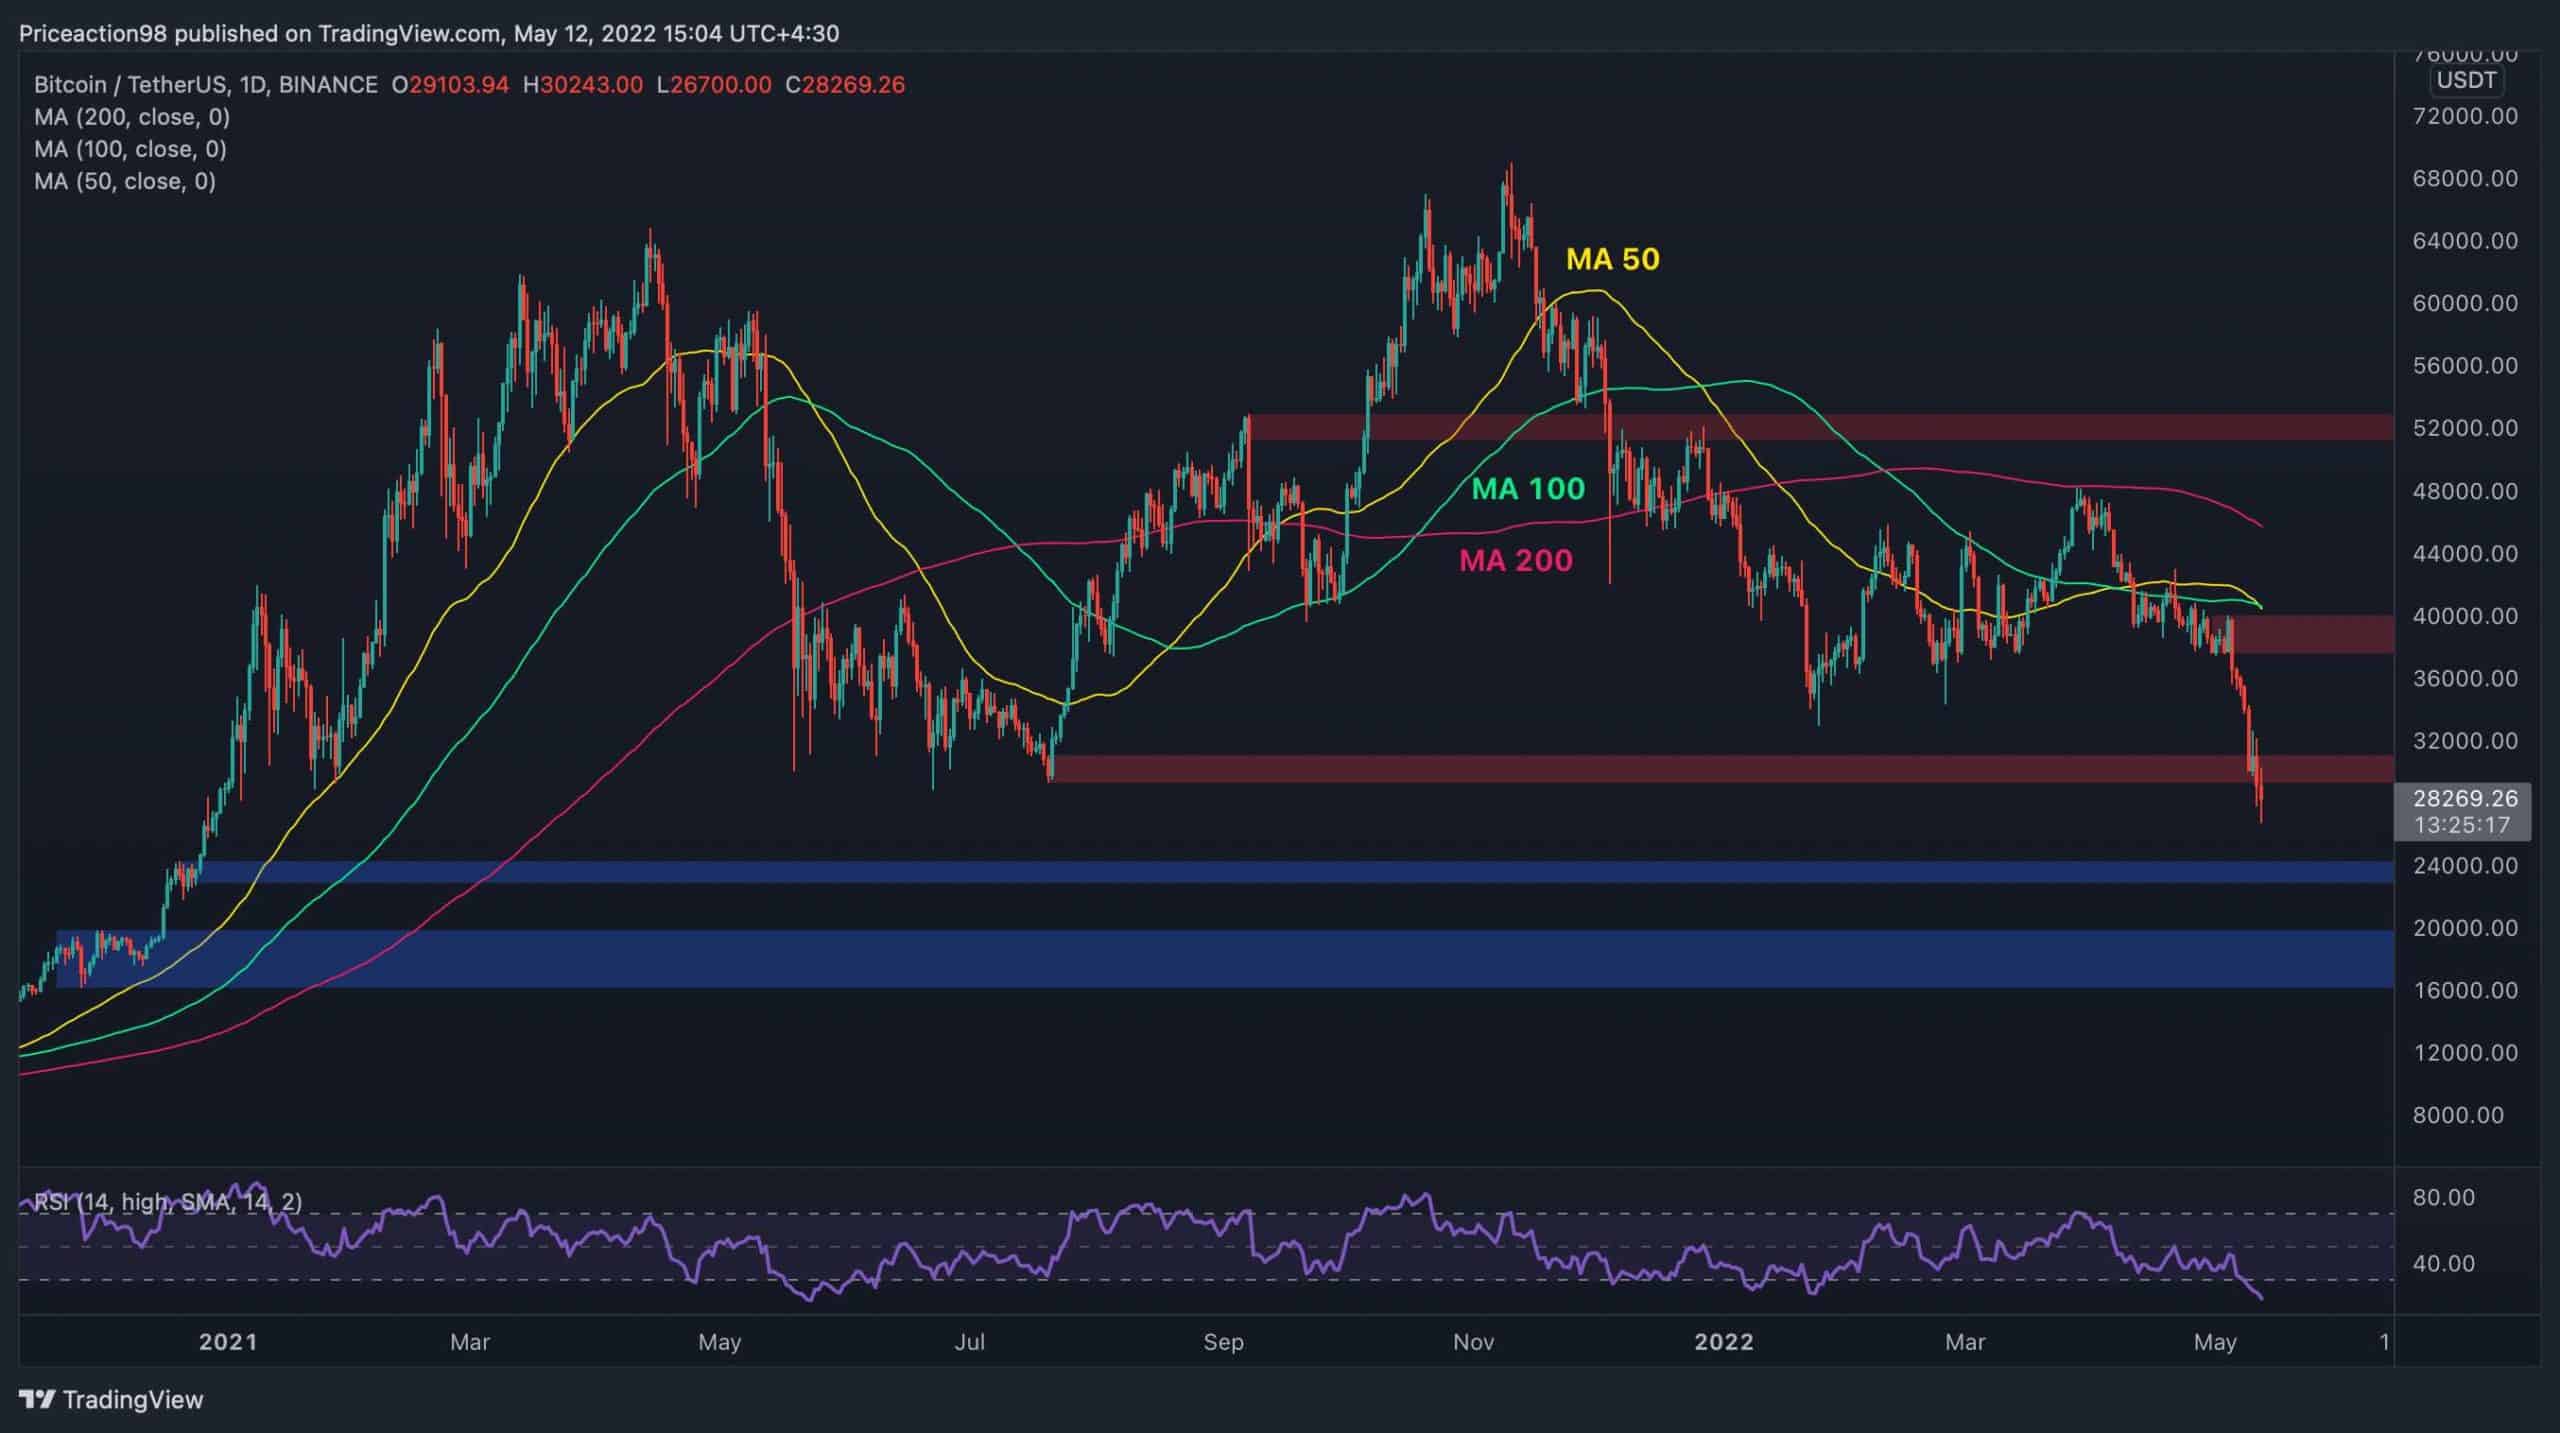
Bitcoin’s price has been dropping almost vertically over the past couple of days, as it was rejected from the 100-day and 50-day moving averages on multiple occasions.
Technical Analysis
By: Edris
The Daily Chart
The $30K demand zone – which was considered a significant level that could reverse the downturn and initiate an uptrend – has also failed and broken to the downside.
Bitcoin is currently trading around $28K, being massively oversold as indicated by values below 30% in the RSI indicator. In fact, the RSI has reached values last seen during the May 2021 crash. The price could experience a bullish pullback in the short term and retest the broken $30K level.
However, it’s entirely possible for it to continue on the downside towards the $24K and potentially the $20K level, which could finally mark a mid-term bottom. The 50-day and 100-day moving averages are also creating a bearish crossover, which could lead to bolster the probability of lower prices in the short term.

The 4-Hour Chart
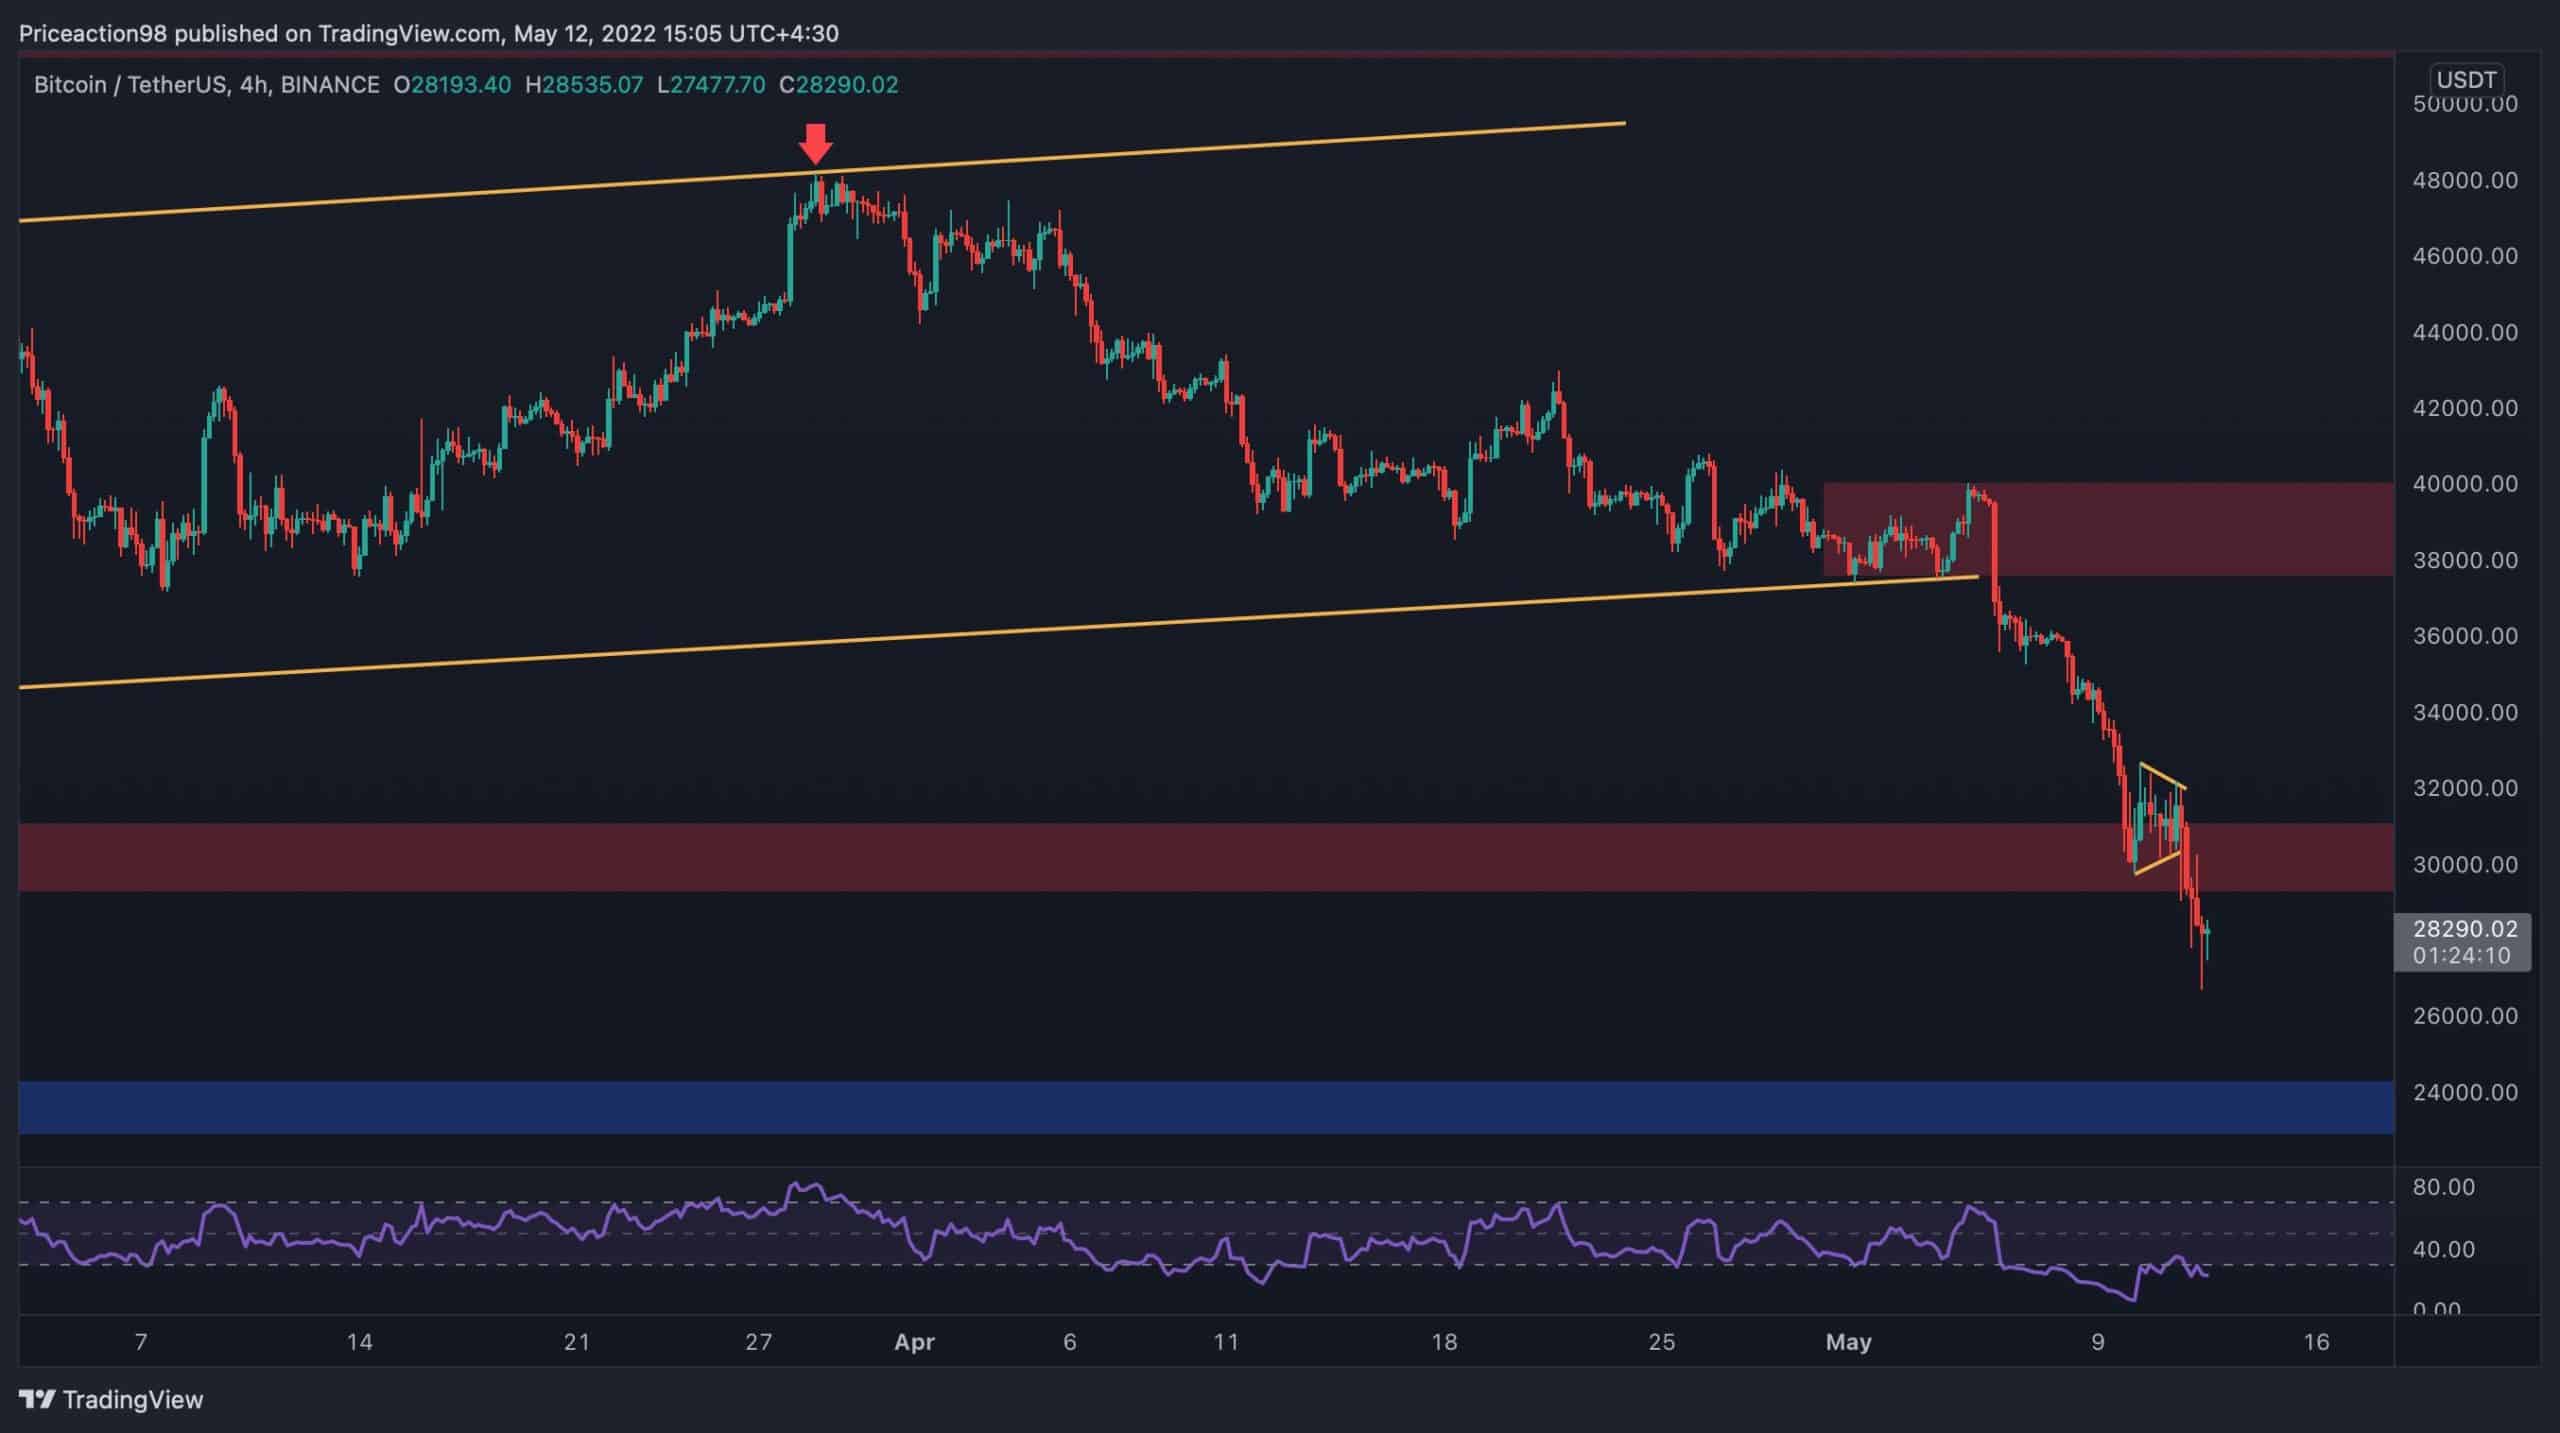
On the 4-hour timeframe, the price has broken below the large bearish flag forming over the last few months, validating a bearish continuation scenario.
The $30K demand zone was providing support for a short period, but it failed immediately after, as a symmetrical triangle pattern formed, signaling the bearish continuation. The downtrend is currently showing signs of exhaustion as the last couple of candles have closed with huge wicks to the downside.
The RSI is also trying to break above the oversold area – a signal which could lead to a short-term bullish pullback to the broken $30K level. However, the bears are in complete control, and an eventual drop to the $24K level remains probable.

Sentiment Analysis
By Edris
Bitcoin Open Interest
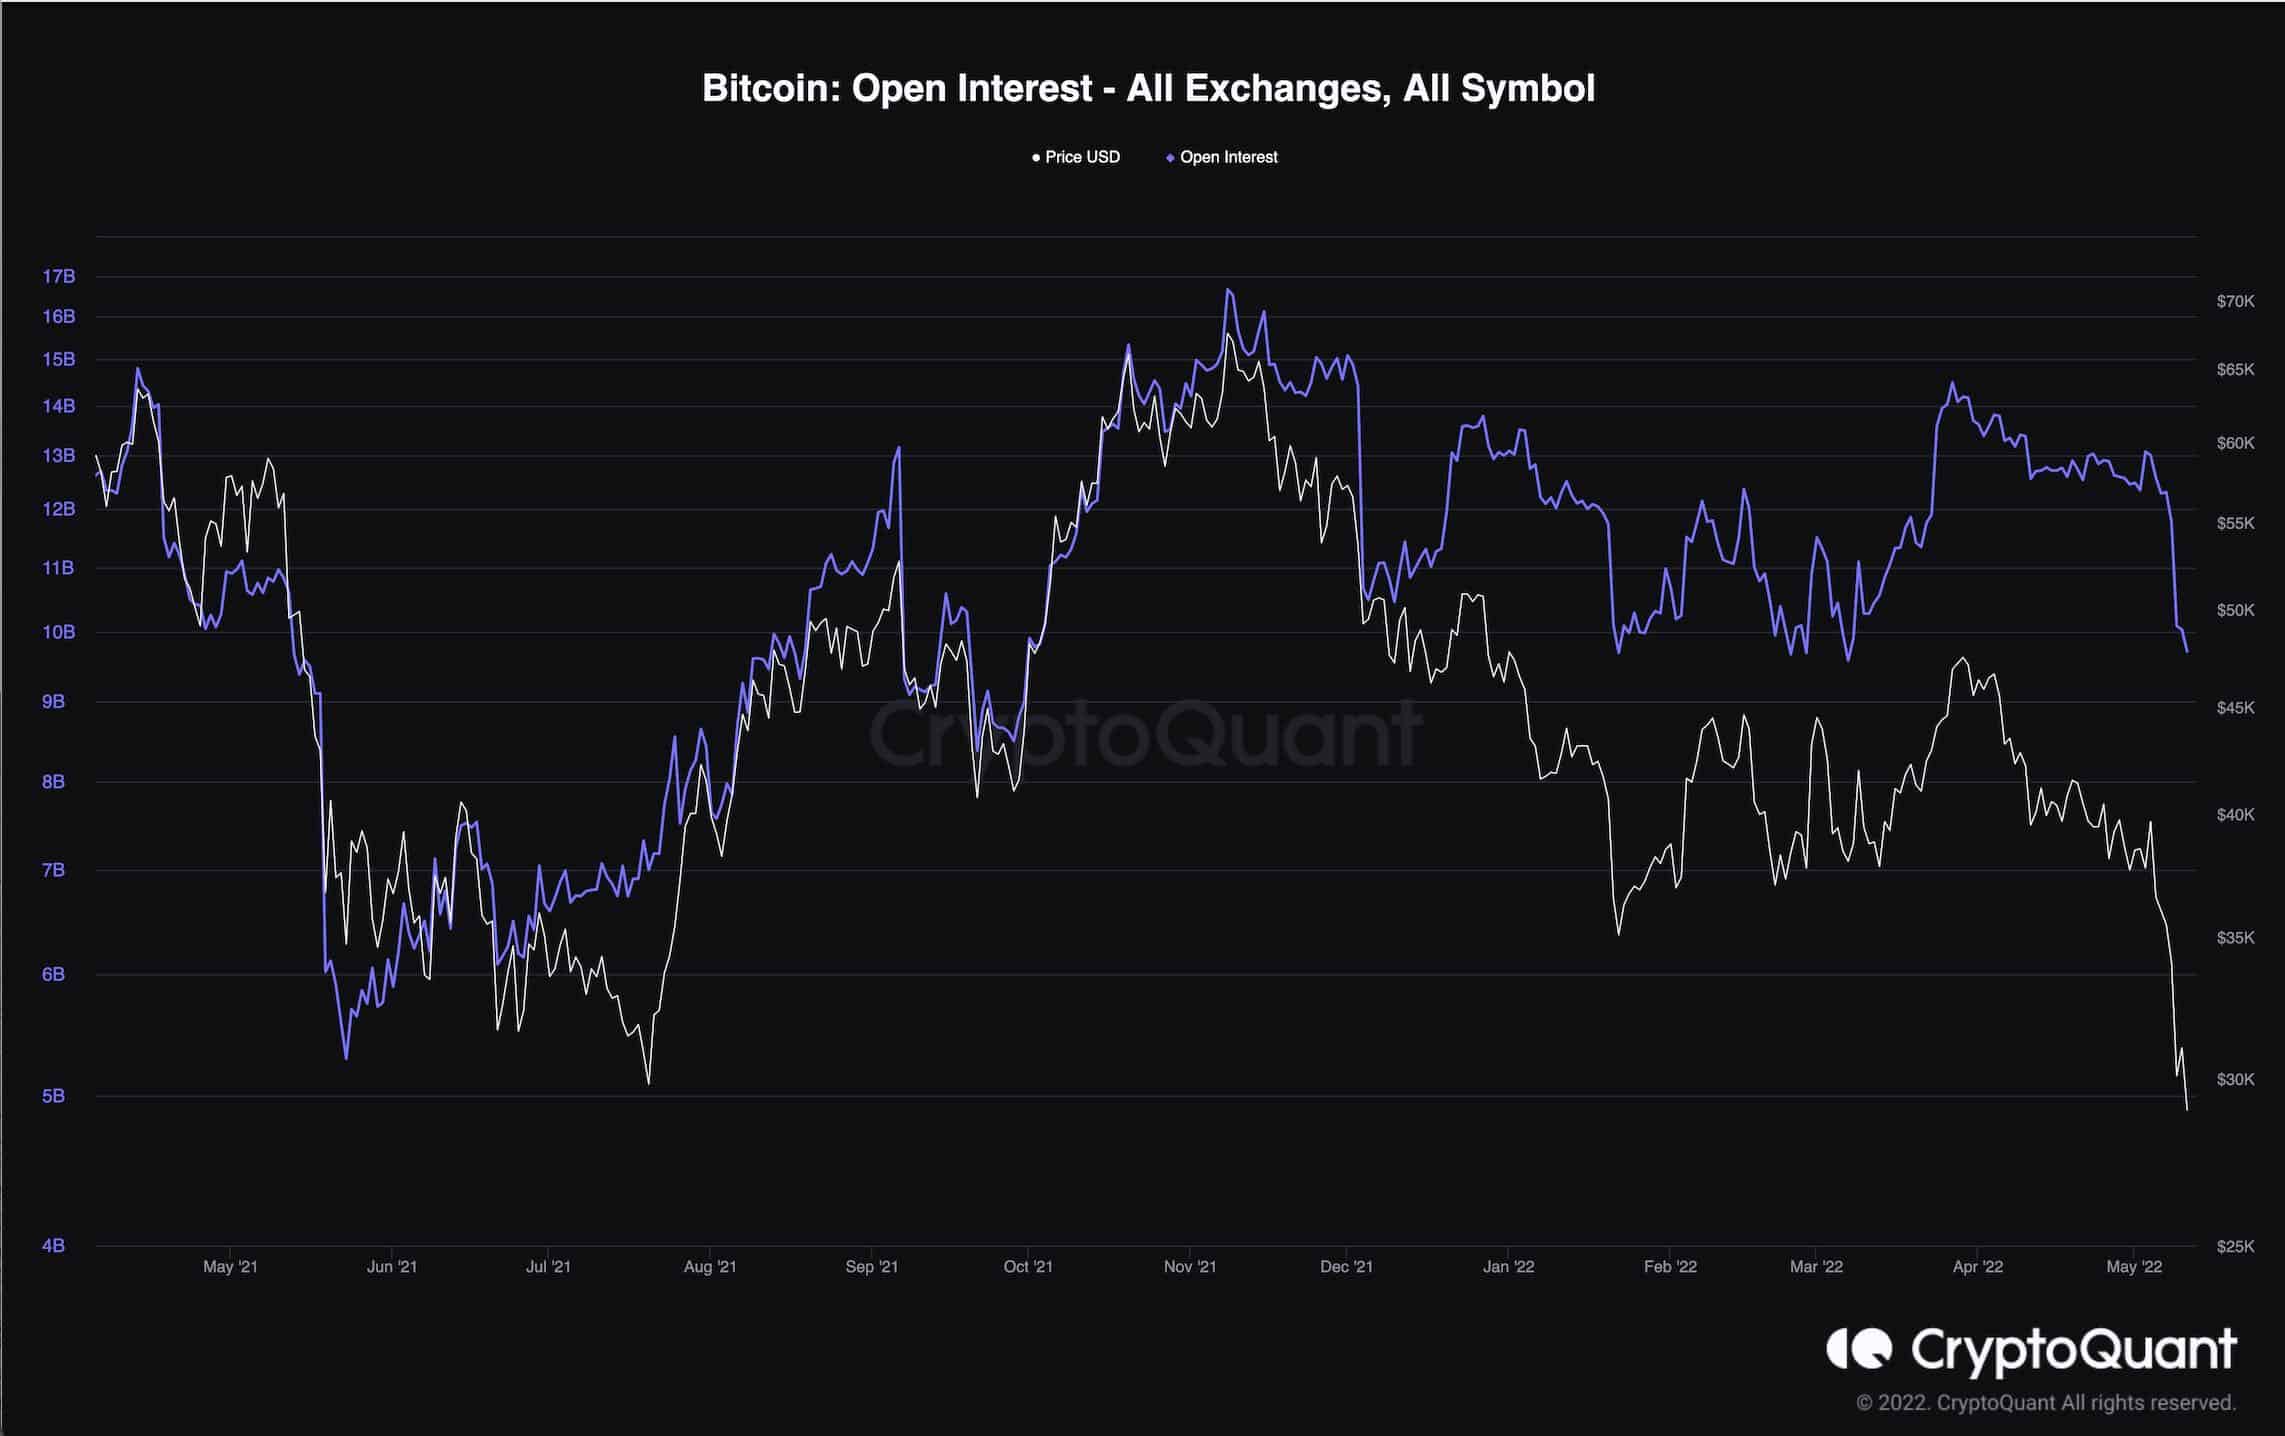
Bitcoin’s price has been crashing rapidly over the past couple of weeks and has even broken below the 2021 ($28K) bottom.
The futures market has certainly played a significant part in this massive drop, as Bitcoin’s open interest had very high levels, even though price was declining from $48K to $37K during April. This slow reduction in Open Interest during an approximately 20% drop was indicating that many stop losses and liquidation targets of long positions were positioned below the $37K, $33K, and ultimately $28K support level.
Following a price drop below these levels, many of the long positions got liquidated, causing a liquidation cascade that aggravated the selling pressure and lead to a stronger downtrend. However, the Open Interest is still much higher than May 2021 after the crash from the $64K ATH, which shows the futures market is still overheated, even after the recent downtrend.
This can be interpreted as a bearish signal, because a high Open Interest usually results in high volatility.


