Bitcoin Back Below $30,000 After A Record 8 Weeks In The Red
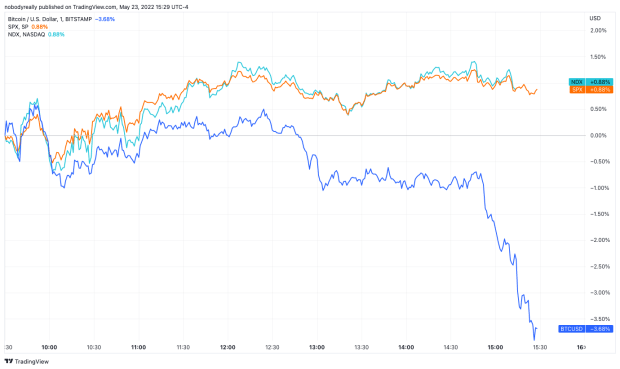
Bitcoin decoupled from equity markets to the downside on Monday after ending last week as the eighth consecutive weekly loss.
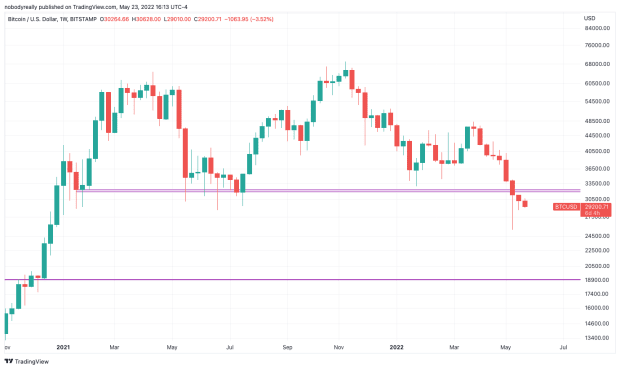
Bitcoin has failed to hold the $30,000 level on Monday after scoring its eighth consecutive week in the red for the first time ever.
During these eight weeks, which began in late March and ended on Sunday, bitcoin has lost over 35% of its U.S. dollar value according to TradingView data. Before the beginning of the losing streak, BTC was trading at around $46,800.
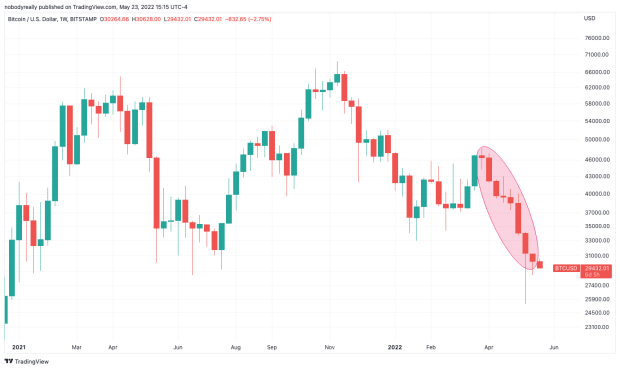
Bitcoin is changing hands slightly below $30,000 at the time of writing. The peer-to-peer currency climbed as high as $30,600 earlier on Monday to trade at around $29,400 as the trading in equity markets nears its end in New York.
While bitcoin turns south, major U.S. stock indices have been in the green. The Nasdaq, which is said to be highly correlated with bitcoin, decoupled from the digital money along with the S&P 500 to denote modest gains near market close on Monday, per TradingView data.
A Tough Year For Bitcoin
Despite making two new all-time highs in 2021, bitcoin already erased nearly all of those gains in 2022.
Bitcoin’s choppy trading year so far can be partly attributed to a broader sentiment of economic uncertainty as the Federal Reserve tightens the U.S. economy, withdrawing liquidity from the market after almost two years of quantitative easing.
The central bank has already raised its basic interest rates two times this year, the last of which was double the magnitude of the previous one and represented the largest hike in two decades: While the Fed increased interest rates by 0.25% in March, it raised them by 0.50% earlier this month.

When the Fed raises or lowers interest rates through its Federal Open Markets Committee (FOMC), what it is actually doing is setting a target range. The graph above depicts the lower and upper bounds of that target range in red and blue, respectively.
While the U.S. central bank system sets the target, it cannot mandate that commercial banks use it — rather, it serves as a recommendation. Therefore, what banks end up using for lending and borrowing excess cash between them overnight is called the effective rate. This is shown by the green line in the graph above.
The Fed previously hiked interest rates consistently from 2016 to 2019, until plunging it near zero in the aftermath of the COVID-19 pandemic outbreak, as noted in the graph.
Bitcoin’s higher sensitivity to liquidity and therefore interest rates can be explained by a greater participation of institutional investors in the market, whose allocations are based on the availability of capital and broader economic conditions, Morgan Stanley reportedly said.
Therefore, while Bitcoin was able to sustain a bull market in the midst of the Fed increasing interest rates in 2017, raising nearly 2,000% from January to December that year, the odds aren’t on the side of the bulls this year.
