Bitcoin Attempts a Recovery, is $25K Next? (BTC Price Analysis)
Bitcoin’s price has been consolidating below a significant resistance level in recent weeks after continually failing to break it to the upside. While there is still a high probability for the price to break above this crucial point, multiple support levels are also available if a pullback were to occur.
Technical Analysis
By: Edris
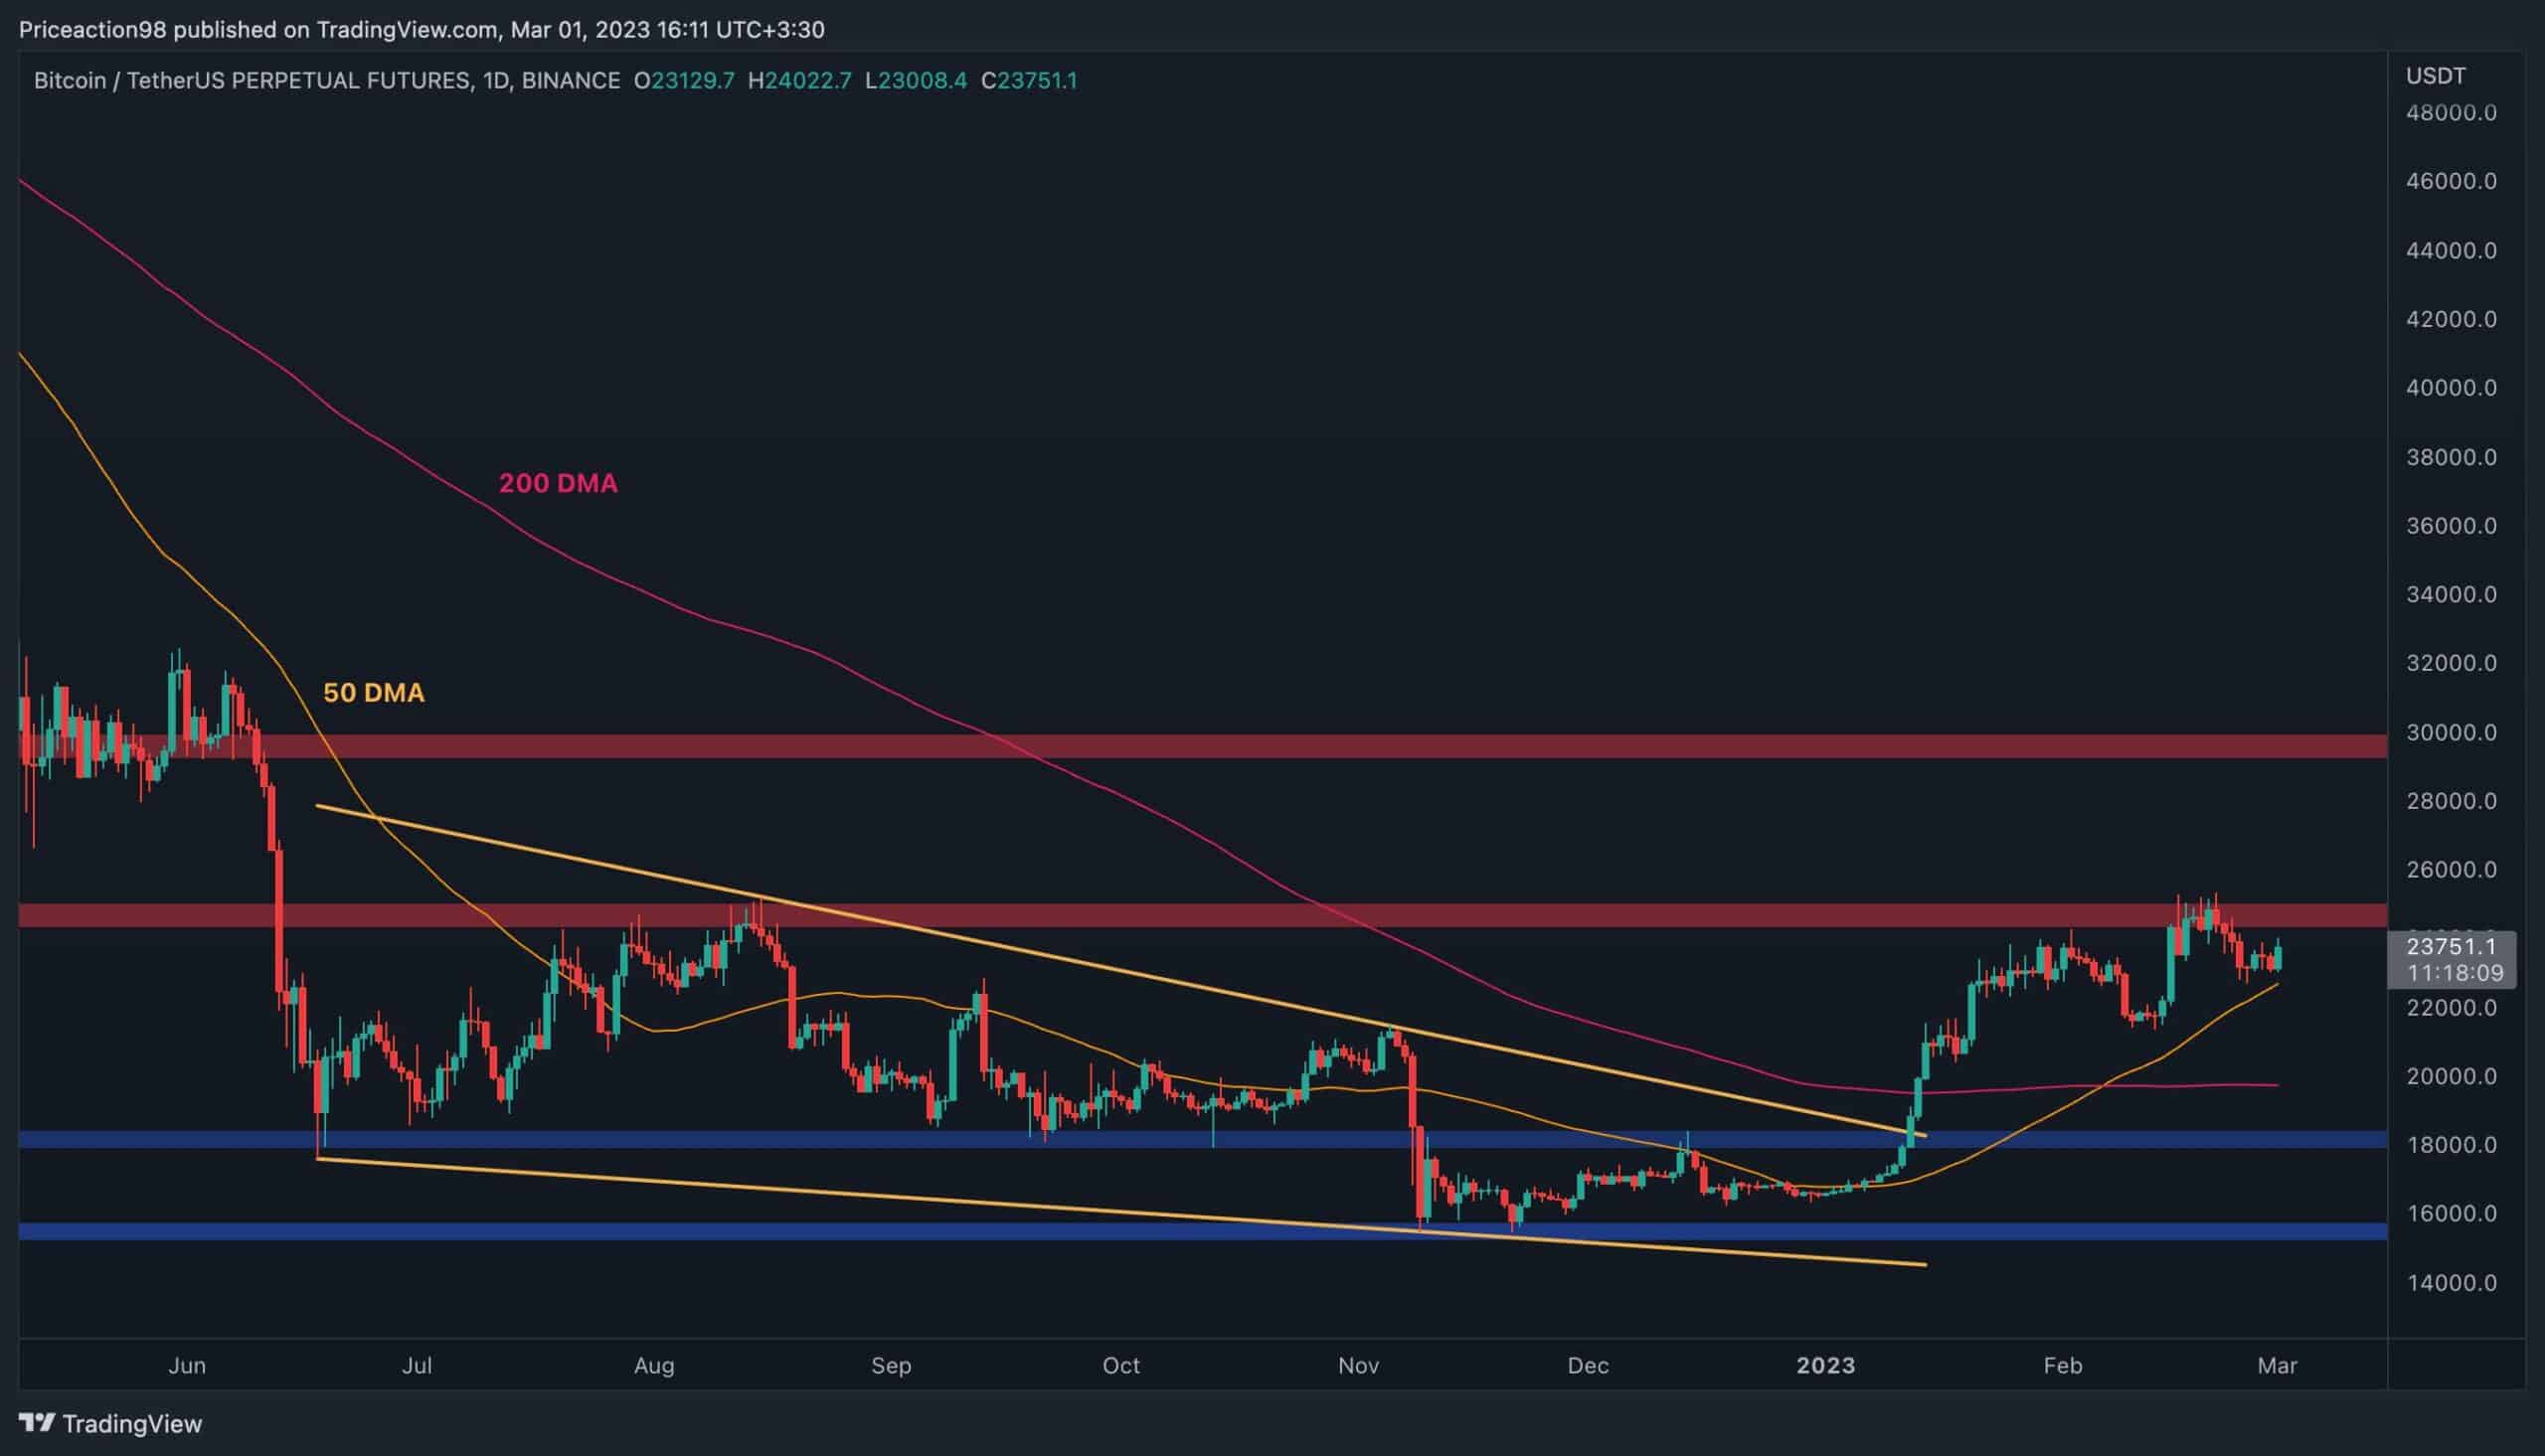
The Daily Chart
On the daily chart, the price has been rejected from the key $25K resistance level multiple times recently. Currently, the 50-day moving average, located around $23K, is providing support and could push the price upside to test the $25K level once more, with a bullish breakout being more probable in this case.
In contrast, if the 50-day moving average gets broken to the downside, the 200-day moving average trending around the $20K psychological level could come into play and prevent any further decline.
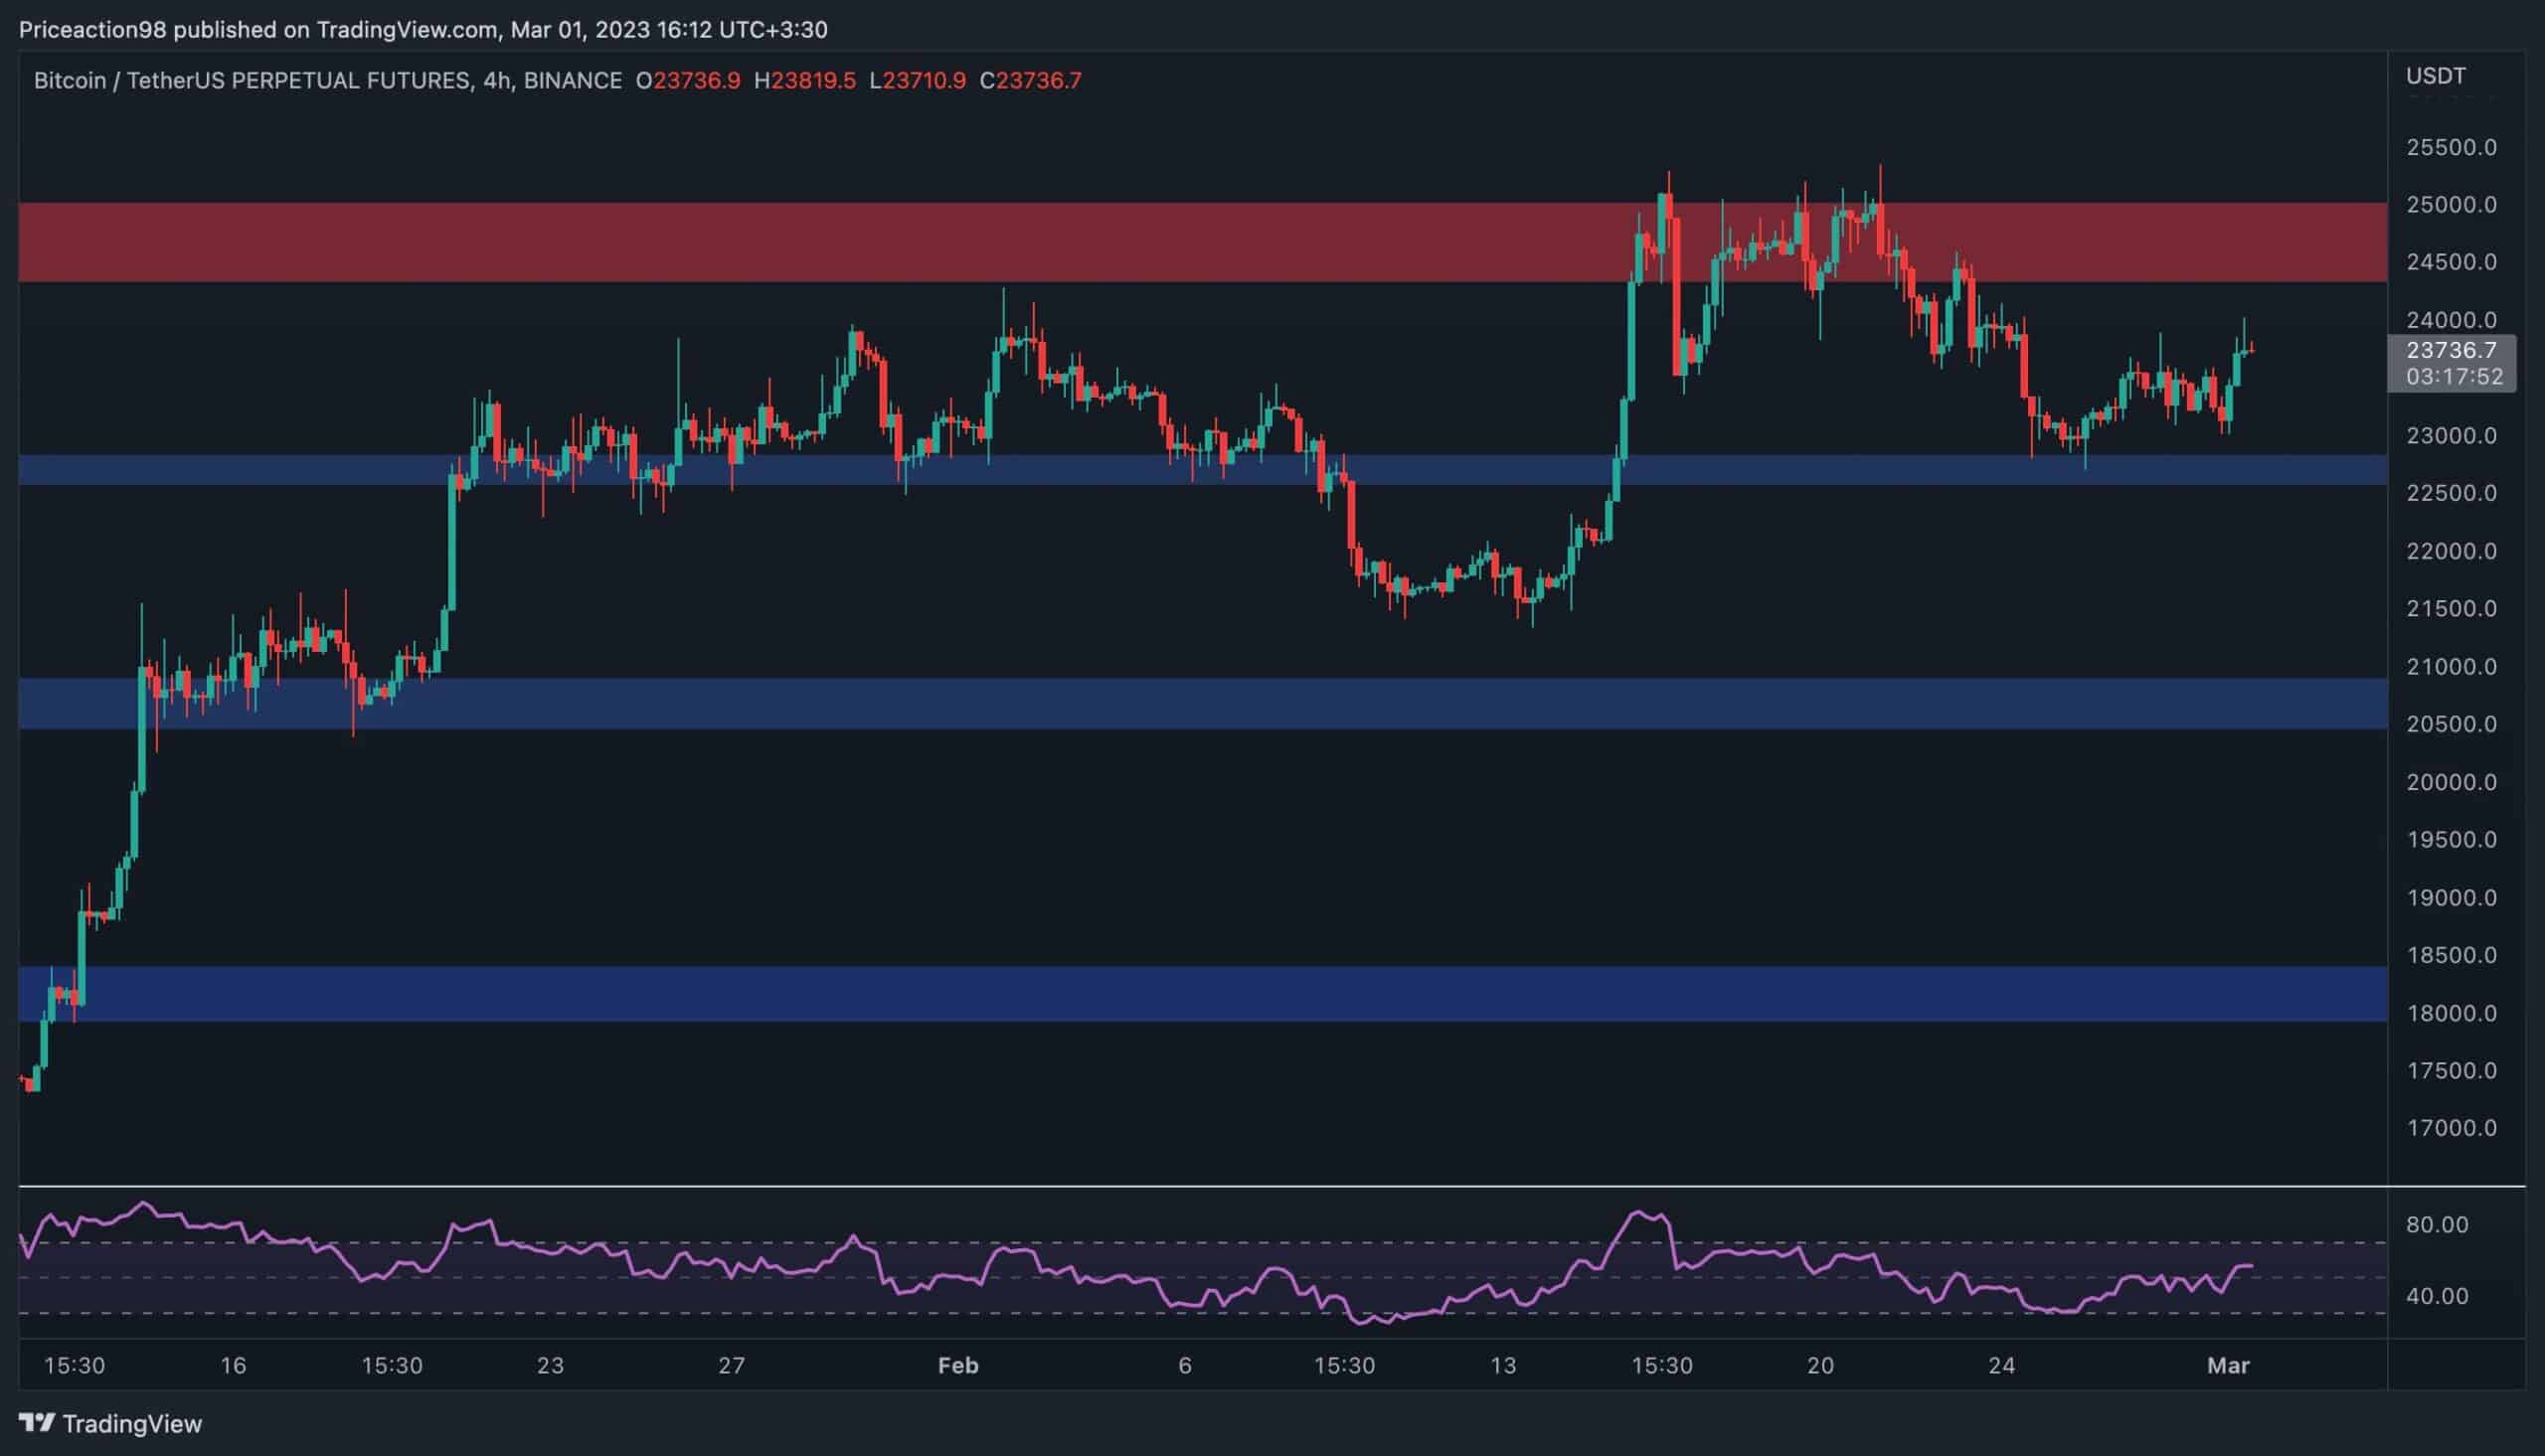
The 4-Hour Chart
Within this time frame, the recent oscillations become much more clear. The price has dropped to the $22,500 support level following a rejection from $25K, with the mentioned support successfully holding the market.
Currently, the cryptocurrency appears to be targeting the $25K level once more, and the likelihood of a break above this point would be higher than before if the price is able to reach it. On the other hand, in the event of a deeper pullback and a drop below $22,500, the $21K level would be the next area to watch.
The RSI indicator is also showing values above 50%, which points to the bullish momentum in this timeframe, making the positive scenario more likely.
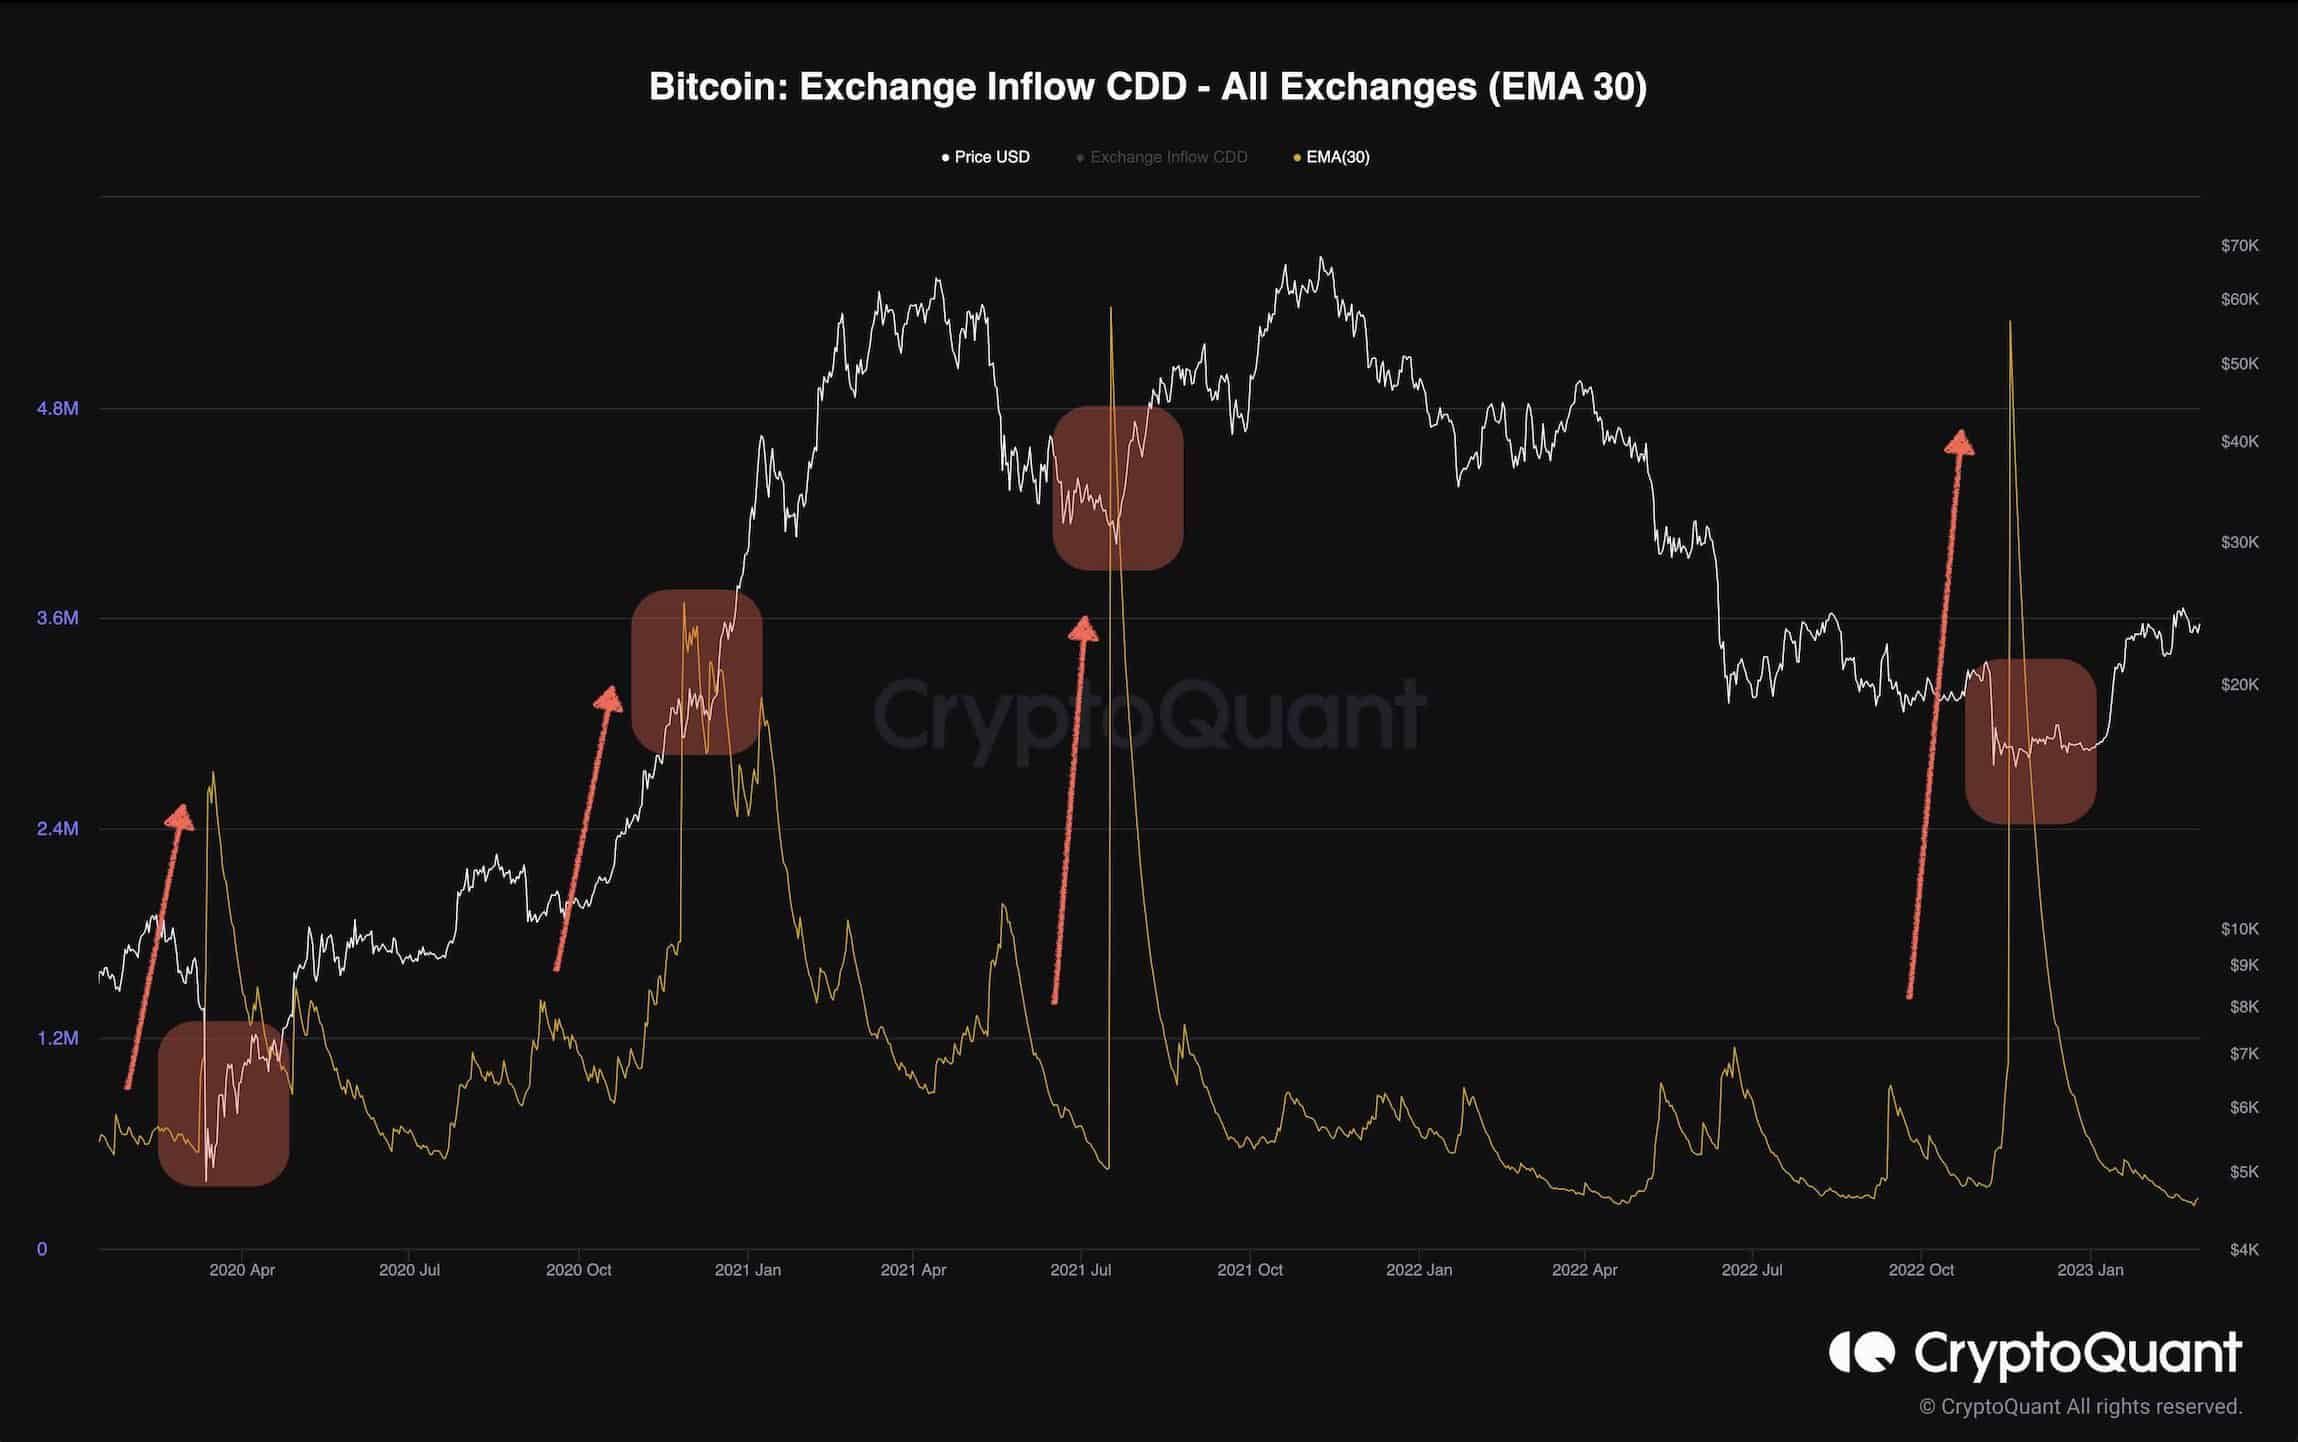
Onchain Analysis
By Shayan
The Exchange Inflow CDD measures the CDD value of coins destroyed by flowing into exchanges. High values indicate that more long-term holders moved their coins to the exchanges with the possibility of distributing them.
The metric surged each time before the price tended to break a vital sentimental price level, a sign of significant capitulation. For instance, after the massive crash due to China’s FUD in July 2021, the price dropped to the $30K crucial level, and after Exchange Inflow CDD suddenly spiked, Bitcoin found the bottom and began an impulsive rally.
Most recently, after Bitcoin plummeted to the $16K level, the metric experienced a surge and reached the same level as July 2021. Right after, the price began a bullish rally, and many believe that Bitcoin has found its bottom at $16K.
Due to the Exchange Inflow CDD’s historical behavior, there is a high possibility that Bitcoin has initiated the next bull market. Yet, due to the nature of the cryptocurrency market, it’s important to consider the alternative as well.
The post Bitcoin Attempts a Recovery, is $25K Next? (BTC Price Analysis) appeared first on CryptoPotato.