Bitcoin and Stocks: The Model Implying BTC Should Have Hit $25,000
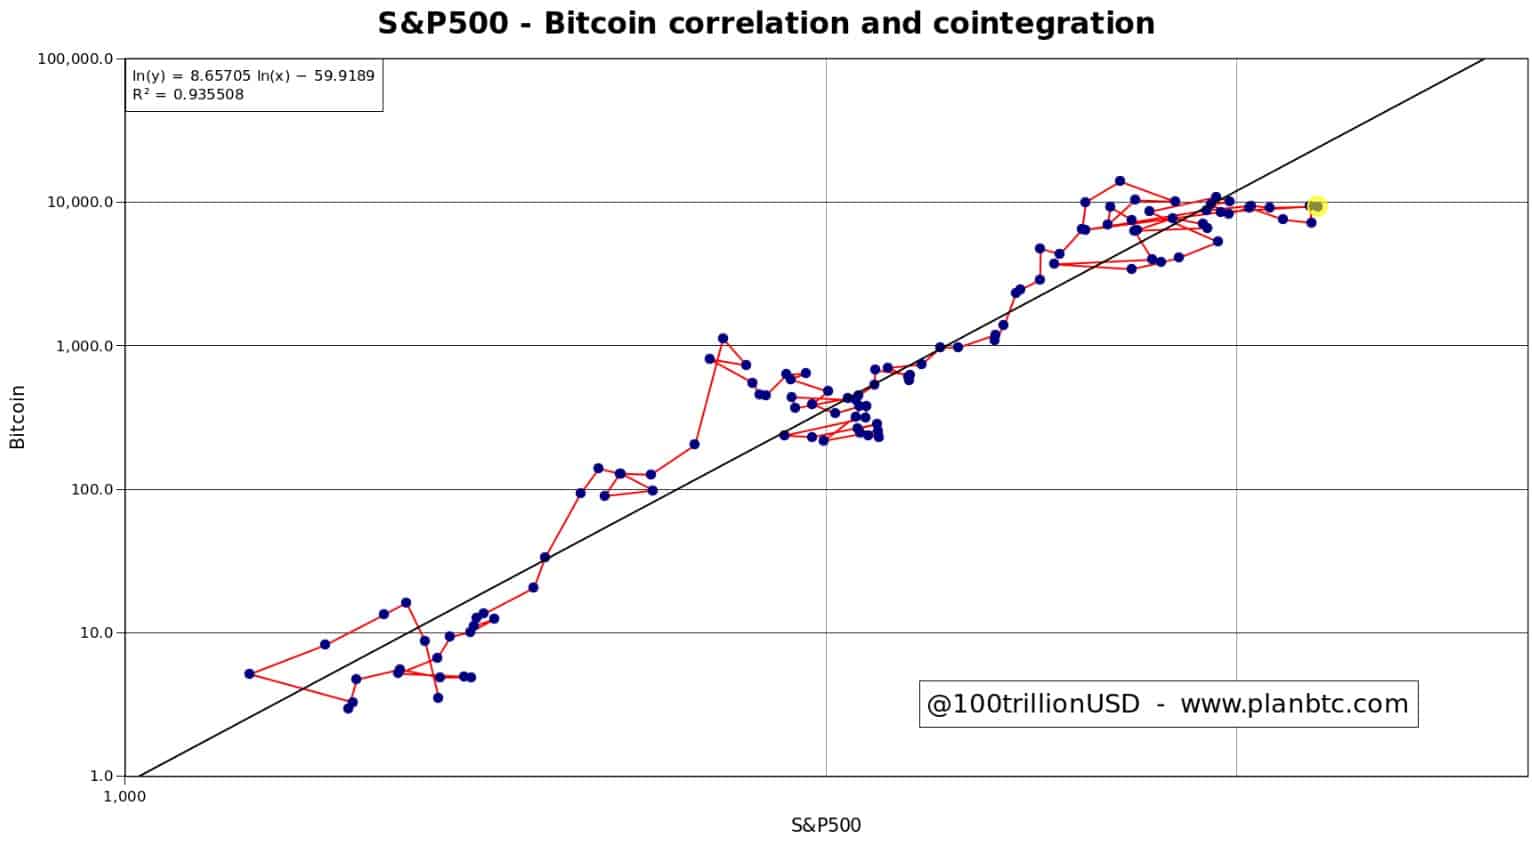
Owing to its decade long correlation with the S&P 500 stock market index, Bitcoin stock-to-flow (S2F) model propounder Plan B thinks that BTC should have surpassed it’s previous ATH and hit the $25,000 price mark.
‘S&P Implied BTC Price: $25K .. Interesting Times Ahead!’
Plan B takes an interesting place amongst numerous other ‘Bitcoin analysts’ on crypto Twitter. A firm believer in the stock-to-flow model that he created for BTC, he posts daily price and market updates on his profile (based on his mathematical model).
According to a tweet that he posted today, Bitcoin should be worth $25,000 now. And how? Due to it’s ‘correlation and cointegration with the S&P 500 over the last ten years.
S&P500 and Bitcoin have been correlated and co-integrated last 10 years. S&P implied BTC price: $25K .. interesting times ahead!

Explaining ‘implied price’ to a fellow Twitterati, he said that the previous S&P 500 close at around 3250, implies BTC hitting $25K. He also said that Bitcoin is like a ‘leveraged S&P position’ and that according to his chart, twice the position on S&P 500 is ‘400 times the position on BTC’, because the cryptocurrency rallies faster than the former.
Why Are Bitcoin Price And S&P 500 Correlated?
For the uninitiated, the striking correlation between Bitcoin and the stock market index may come as unreasonable or simply confusing. But the famous BTC analyst has sought to clarify the doubt.
As per a tweet shared precisely a month back, Plan B pointed out that Bitcoin gains positively from several actions carried out by the United States Federal Reserve. The most prominent of them being ‘quantitative easing (QE)’. He goes on to say that the Fed’s actions’ support’ the top cryptocurrency.
“Don’t Fight the FED” is old Wall Street wisdom.
Great thing that #Bitcoin is fully aligned with FED interests (QE to save banks & companies). BTC is correlated (95% R2) and cointegrated with US equities (S&P500). So BTC is not an uncorrelated asset and supported by FED actions. pic.twitter.com/xYaFLS3Wl0— PlanB (@100trillionUSD) June 21, 2020
Plan B says that correlation is so thick that when the FED tried to stop QE in November 2018, both the S&P 500 and Bitcoin suffered a freefall. Thus, the central bank will never repeat it.
But If That’s The Case Then Why is BTC Still Down ~53 Percent
Lately, Bitcoin’s price chart has reported a drop in volatility and sporadic price action. But why?
The reason can be found in this article by Harold Christopher Burger. According to Harold, two things have become clear regarding BTC’s recent price evolution:
- The case for bitcoin’s diminishing yearly returns is growing stronger.
- Bitcoin price fluctuations are becoming less extreme in the short term.
A plausible explanation for the observations is investment capital. It takes more and more fiat currency to move BTC’s price higher. Apparently, it is becoming increasingly difficult to find the requisite capital to do so.
In Burger’s words:
Moving the price of bitcoin from $0.1 to $1 was possible with relatively few dollars. Moving the price of bitcoin from $1000 to $10000 required much more capital. This effect slows the potential growth of bitcoin in both the long- and short-term.
Future bull markets are expected to be much slower, and longer-term Bitcoin returns will be less as per his research.
The post Bitcoin and Stocks: The Model Implying BTC Should Have Hit $25,000 appeared first on CryptoPotato.


