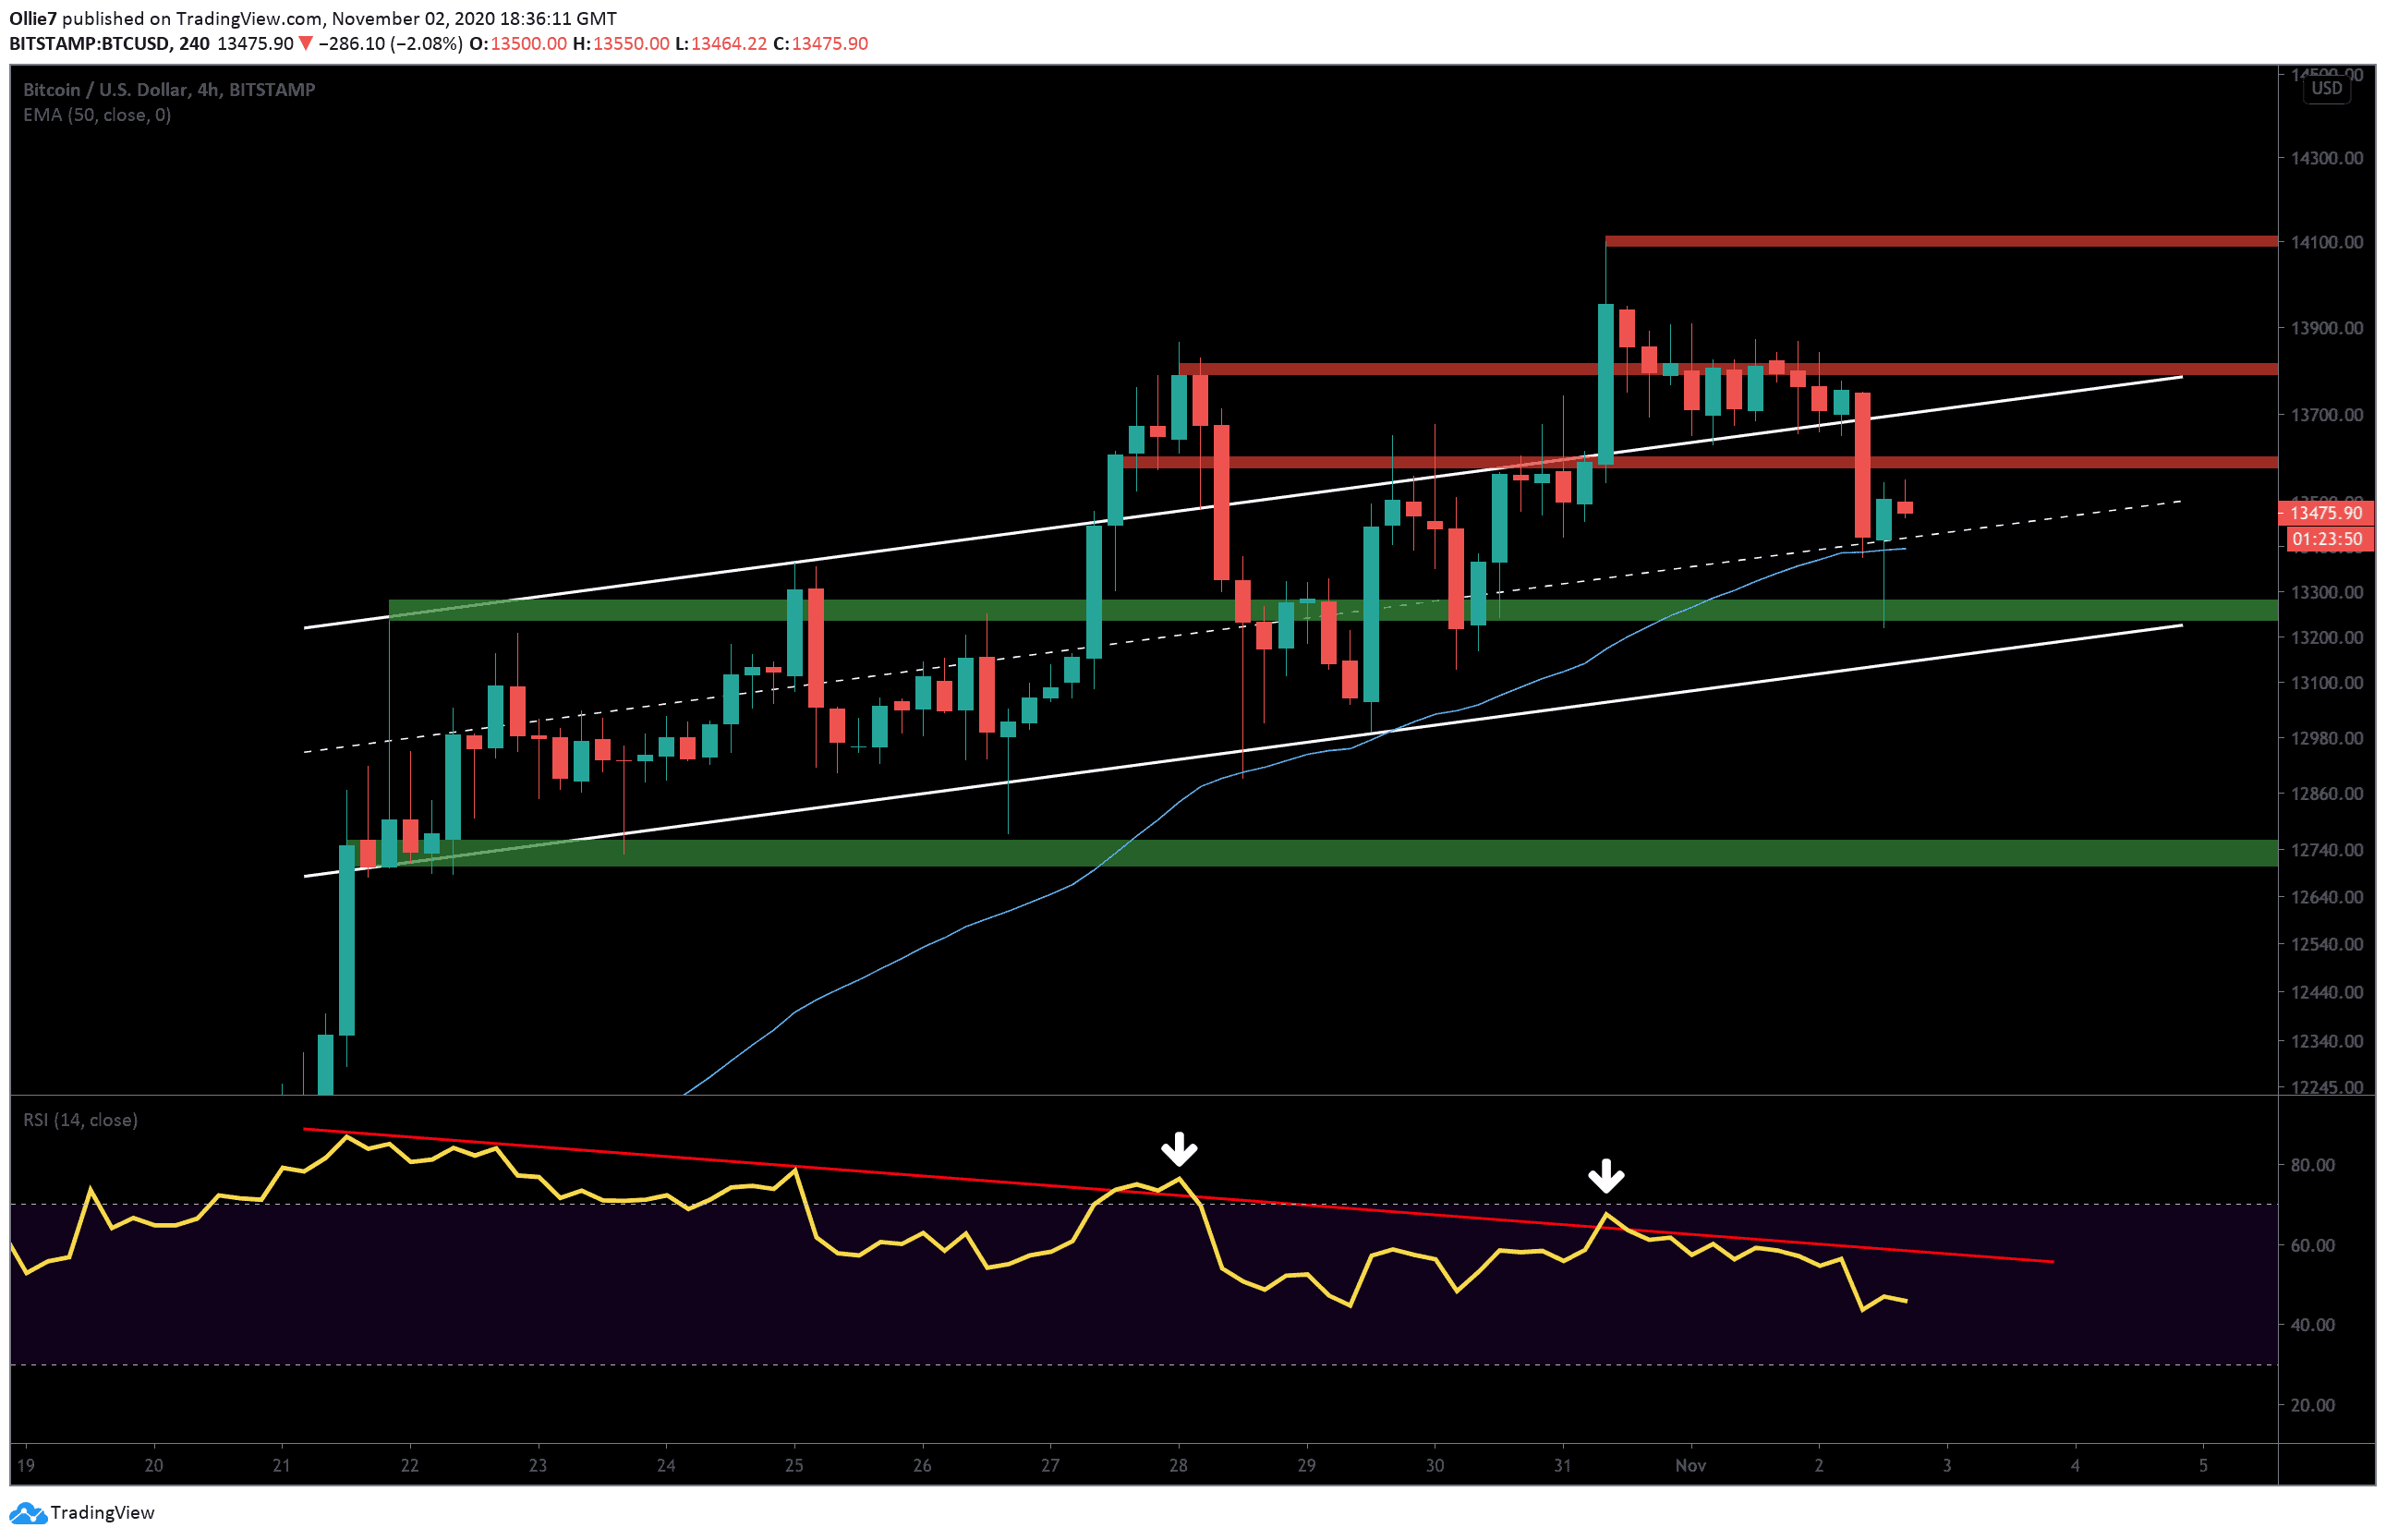
Bitcoin $600 Below Saturday’s 2020 High, Retest Incoming? (BTC Analysis)
Bitcoin bulls have managed to regain the $13.4K support today after prices crashed 3.7% in 4 hours.
Uncertainty in the stock markets and the upcoming US presidential elections could have played a role in today’s crypto market activity, as larger traders tend to withdraw into more stable assets ahead of significant global events.
$12 billion has exited the markets during the latest sell-off along with a $14 million long squeeze.
Price Levels to Watch in the Short-term
On the 4-hour BTC/USD chart, we can see that the price action is now back inside the rising channel pattern after failing to find new support on the former resistance.
During the latest 4-hour close, we can see that BTC buyers were successful in recovering to the median line (white dashed line), which is also being reinforced by the 50 EMA (blue). Now, however, they’re being hampered by the $13,500 level. This will be the first key target to bulls to break if Bitcoin is to begin its climb back up to $14K. From there, $13,670 and $13,800 will also likely see reactions from bearish traders if Bitcoin attempts to break back out of the channel.
Looking above those targets, we have the $13,950, the new 1000+ day high of $14,100, and a daily resistance around $14,390.
If momentum wanes during the rest of this week, we could see the leading crypto asset break under the 50 EMA/ median line and take refuge along the $13,280. We may even see bitcoin wick below the main channel support around $13,150 as larger players attempt to shake out weak hands before a resurgence.
Looking at the RSI, we can see that BTC is still stuck under the down-trending resistance (red) and continues to print lower lows. A breakout above this line should give us a good confirmation that bullish momentum is building behind the asset again and could deliver another rally if it manages to hold above 60.
Total market capital: $400 billion
Bitcoin market capital: $250 billion
Bitcoin dominance: 62.5%
*Data by Coingecko.
Bitstamp BTC/USD 4-Hour Chart