Binance Coin Price Analysis Jun.6: BNB Rebounds Back Above $30, Will The Bearish Sentiment Hold It?
Binance Coin has recently rebounded from support level around $28.88 over the past couple of days – bringing the current price for the cryptocurrency back up toward the $31.13 area.
Despite the recent 7% price fall seen over the past week, Binance Coin is still up by over 100% over the previous 90 days.
Binance Coin currently holds a $4.40 billion market cap valuation which puts the coin in the 7th place amongst the top cryptocurrency projects by market cap value. BNB is the only coin in the top 20 projects to have created a fresh ATH during 2019.
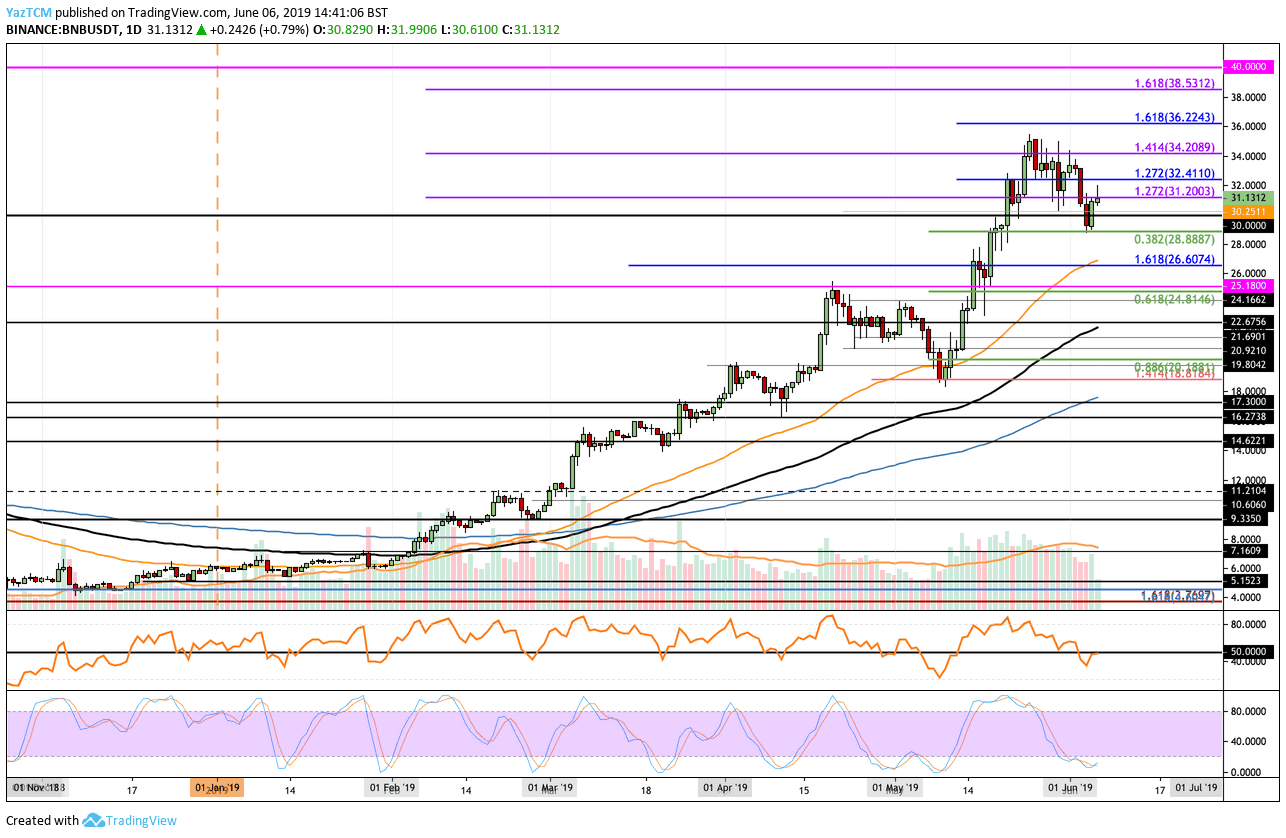
Looking at the BNB/USD 1-Day Chart:
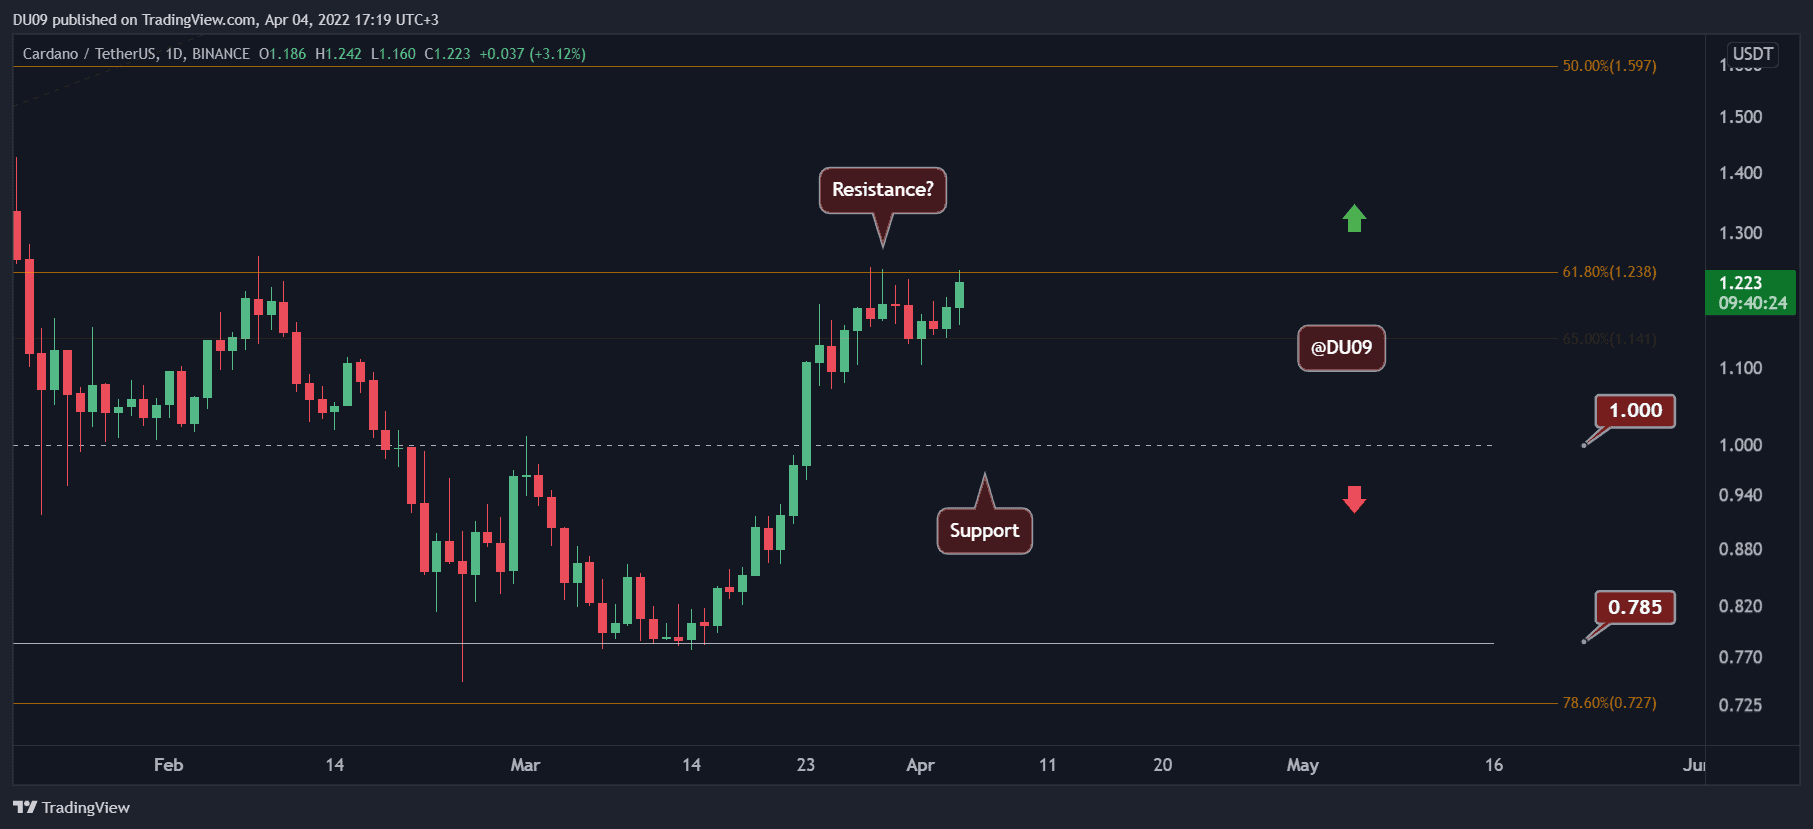
- Against the US Dollar, we can see Binance Coin rebounding at the support at the $28.88 level – which is support provided by a short term .382 Fibonacci Retracement level (drawn in green) priced at $28.88. BNB/USD has since bounced higher and now trades at resistance around the $31.20 level.
- From above: The nearest level of resistance above $31.20 lies at $32.41 and $34.20. If the bulls can continue to break above $35, further higher resistance then lies at $36.22 and $38.53. Further above lies the $40 level.
- From below: The nearest level of support now lies at $30. Beneath this, further strong support is expected at $28.88. If the selling continues beneath $28, further support below is located $26.60, $25.18 and $24.81.
- The trading volume has been below average but has been increasing during the first few days of June.
- The Stochastic RSI oscillator is trading in the oversold territory.
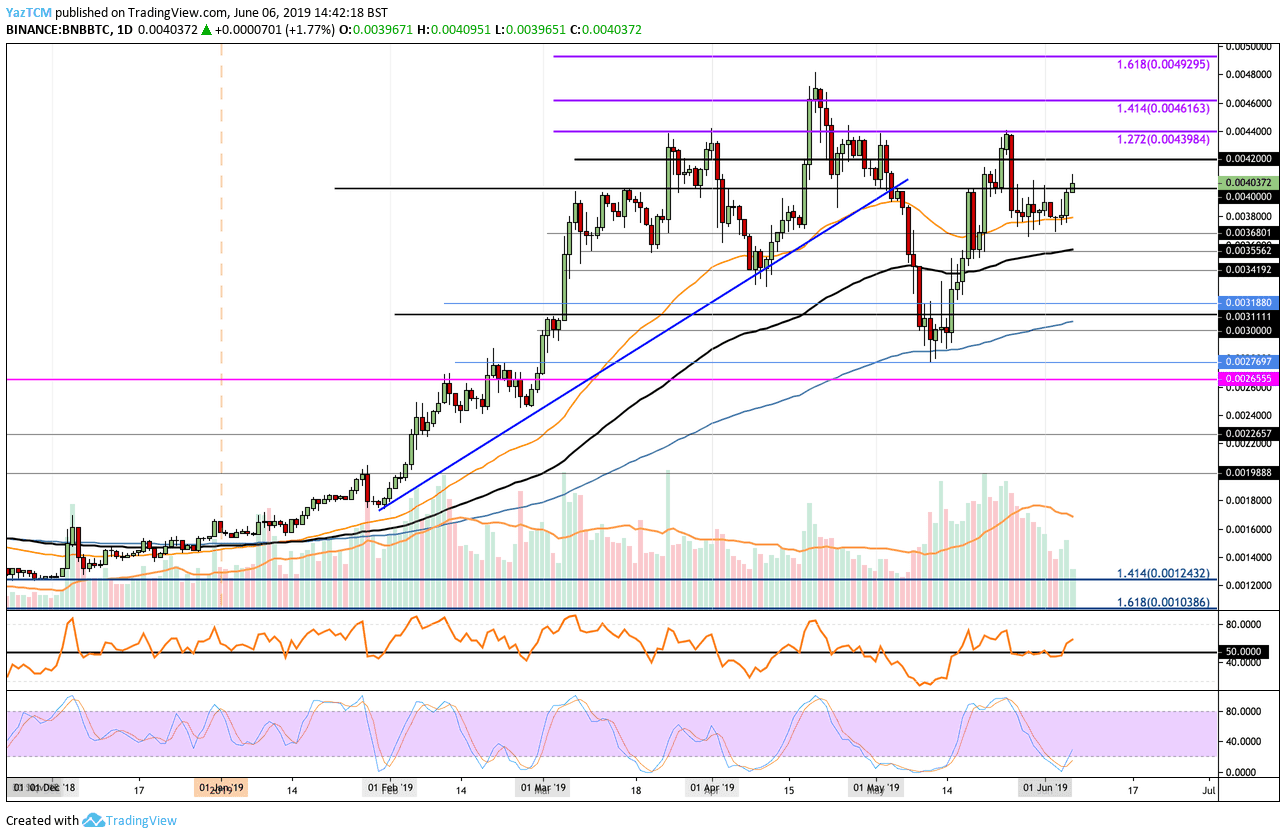
Looking at the BNB/BTC 1-Day Chart:
- Against Bitcoin, we can see that BNB has also dropped from the May 2019 higher round 0.0044 BTC to find support at the 0.003680 BTC level. We can see that BNB/BTC has bounced at this support and is now trading higher above the 0.004 BTC level.
- From above: The nearest level of resistance now lies at 0.0042 BTC. Above this, further higher resistance can be located at 0.004398 BTC and 0.004615 BTC. If the buyers can clear the resistance at $0.0048 BTC, the final level of resistance above is located at 0.004925 BTC and 0.005 BTC.
- From below: The nearest level of support is now located at 0.0040 BTC and 0.0038 BTC. Beneath this, further support lies at 0.003680 BTC, 0.00355 BTC, and 0.003111 BTC.
- The Stochastic RSI has recently produced a crossover at the oversold territory, might lead to a positive correction.
The post Binance Coin Price Analysis Jun.6: BNB Rebounds Back Above $30, Will The Bearish Sentiment Hold It? appeared first on CryptoPotato.