Binance Coin (BNB) has started to climb back toward its ATH value again after increasing with a total of 5% over the past 24 hours to reach a price of $33.32. BNB has seen an epic surge after gaining 118% in the last 3 months. The cryptocurrency has even outperformed Bitcoin over the past 30 days as it managed to increase by a total of 40% as opposed to Bitcoin’s 8% gain.
Binance Coin is now ranked in 7th place among the largest cryptocurrencies with a total market capitalization of around $4.87 billion.
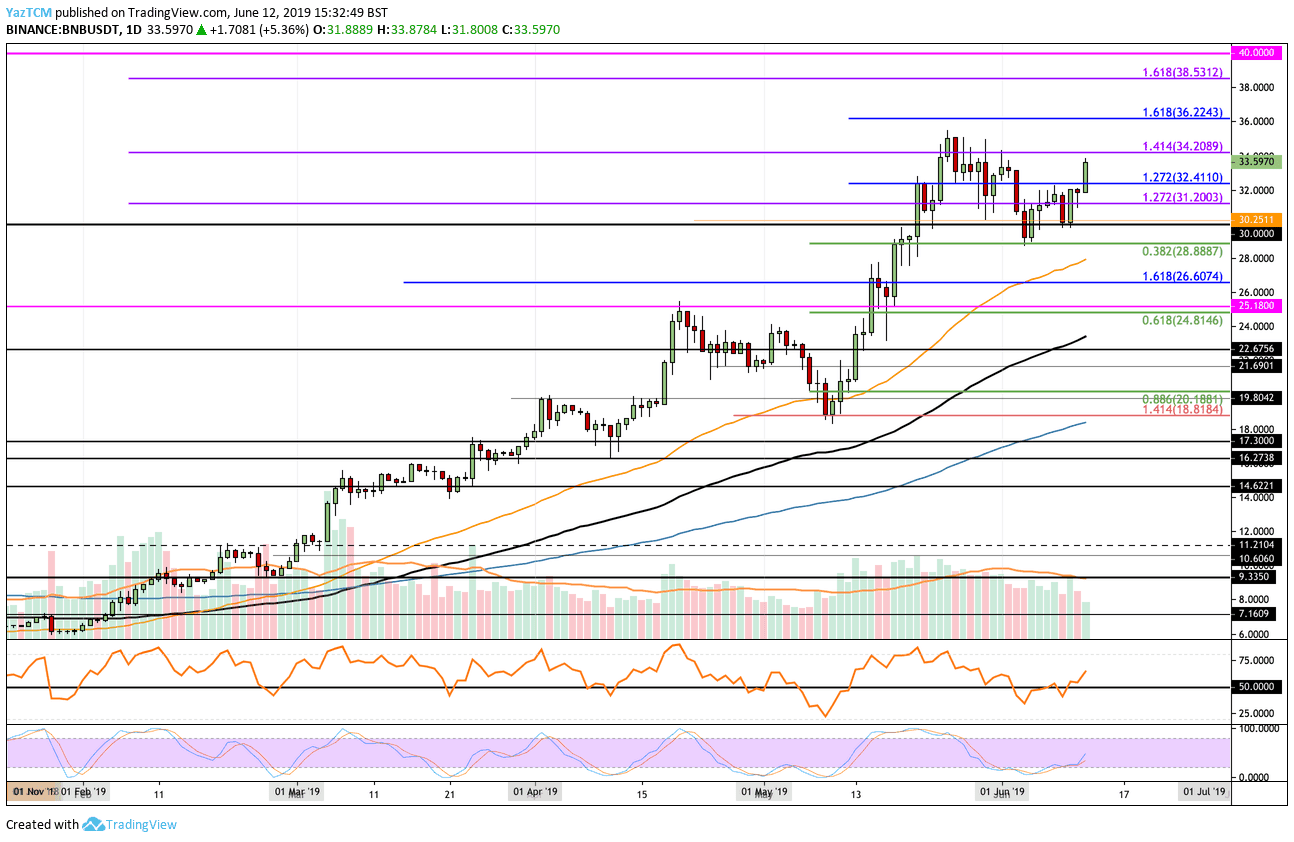
Looking at the BNB/USD 1-Day Chart:
-
Since our previous BNB analysis, we can see that BNB has continued to surge above the previous resistance at the $31.30 level and has climbed higher toward the $33.59 level.
- From above: The nearest level of resistance now lies at $34.20. Above this, further resistance lies at the ATH around $35.48. If the bulls continue above the ATH, higher resistance is found at $36.22 and $37. Above $37, further resistance is located at $38.53 and at $40.
- From below: The nearest levels of support now lie at $32.41 and $31.20. Beneath this, support is located at $30. If the sellers drag the price below $30, strong support is located at $28.88 and $28,
- The trading volume has fallen slightly but still remains relatively high.
- The Stochastic RSI has recently produced a bullish crossover signal in overbought territory which suggests the bullish pressure is likely to push BNB higher.
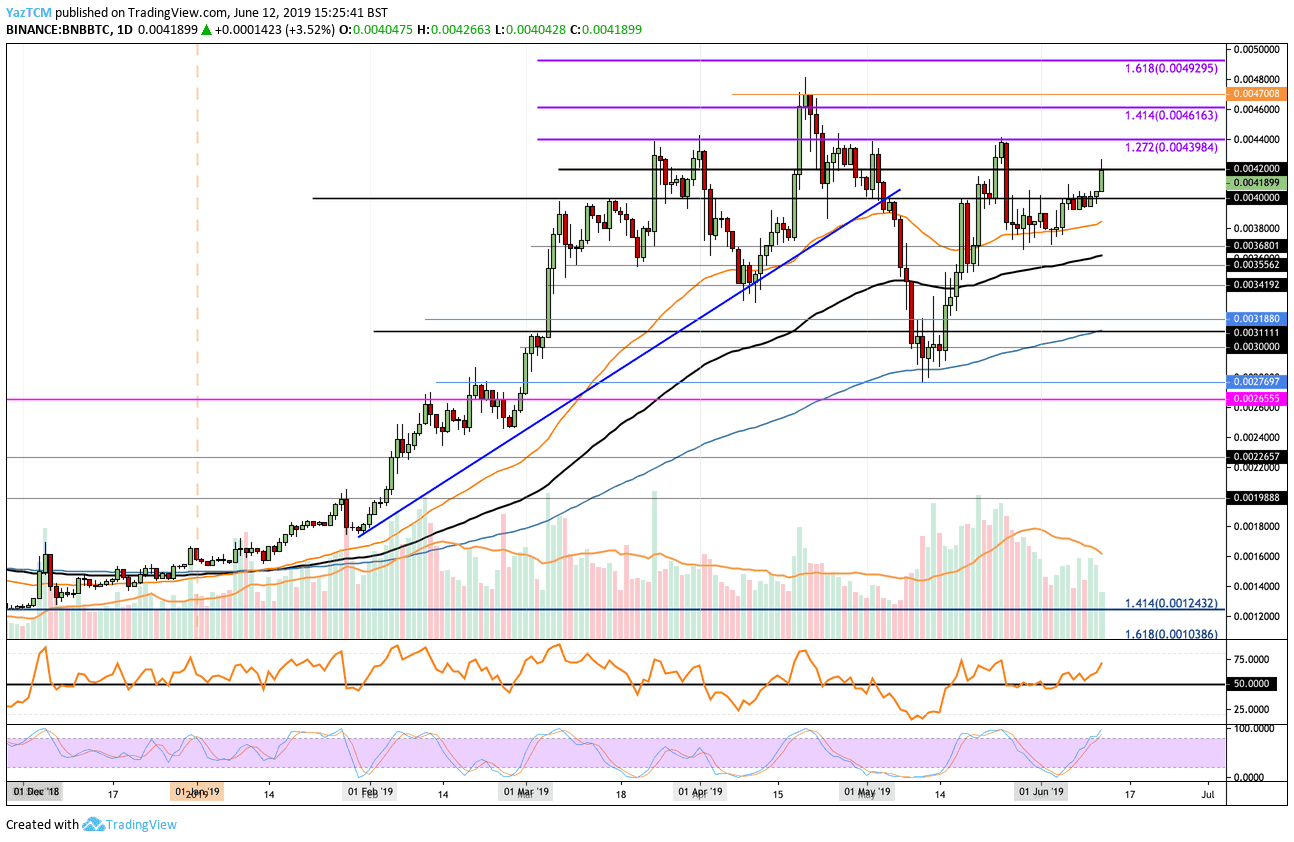
Looking at the BNB/BTC 1-Day Chart:
- Against Bitcoin, we can see that BNB has managed to break above the support at the 0.004 BTC level but has now met strong resistance at the 0.0042 BTC level.
- From above: The nearest level of resistance beyond 0.0042 BTC lies at 0.0044 BTC – the May 2019 high. Above this, further resistance lies at 0.004615 BTC and then at 0.0047 BTC. Above 0.0047 BTC resistance is found at the ATH at 0.004813 BTC and then at 0.004930 BTC.
- The trading volume has dropped during June 2019 but still remains relatively high.
- The Stochastic RSI has recently reached overbought conditions in this market which suggests that traders should be cautious as the market may be a little overstretched.
The post Binance Coin Price Analysis Jun.12: BNB Getting Close To Its ATH appeared first on CryptoPotato.