Binance Coin Price Analysis: Despite The Latest Bullish Binance Announcements, BNB Struggles At $21
Binance Coin saw a slight decrease of around 1% over the past 24 hours and it currently trades at $20.31. Despite the recent decline, BNB is still up by a total of 21% over the past two weeks and a 60% increase over the past 30 days.
The cryptocurrency struggles despite the constant announcements that come from Binance. In fact, just recently, the CEO of the exchange, Changpeng Zhao, shared a tweet that outlines the accomplishments of the company in the past 24 hours alone.
1/2 The $BNB ecosphere in the last 24 hours or so:
– CipherTrace Supports BNB
– @graviex_net lists $BUSD
– @vitelabs lists $BUSD
– Android Update with Russian Support
– @Binance open-sources TSS library
– @bithance lists $BNB
– Ukraine gov’t and @binance enters MOU— CZ Binance (@cz_binance) November 7, 2019
Binance Coin is the eighth-largest cryptocurrency with a market cap of $3.19 billion.
Looking at the BNB/USD 1-Day Chart:
- Since our previous BNB analysis, Binance Coin continued to struggle to break above the resistance at $20.92. This resistance is bolstered by the 100-days EMA and has proven difficult for BNB to overcome over the past 5 attempts. BNB still remains heavily supported at $19.80.
- From above: The nearest level of resistance lies directly at $20.92. Above $21, resistance lies at $21.94 which is reinforced by the 200-days EMA. If the bulls manage to overcome this level, resistance can be expected at $22.74, $23.47, $24.16, and $24.52.
- From below: The nearest level of support lies at $19.80. Beneath this, support is found at $18.86, $18.16, $18.00, $17.30, $16.11, and $15.54.
- The trading volume has started to decline during November.
- The RSI has recently dipped lower but remains above the 50 level which shows that the bulls still remain in charge over the market momentum.

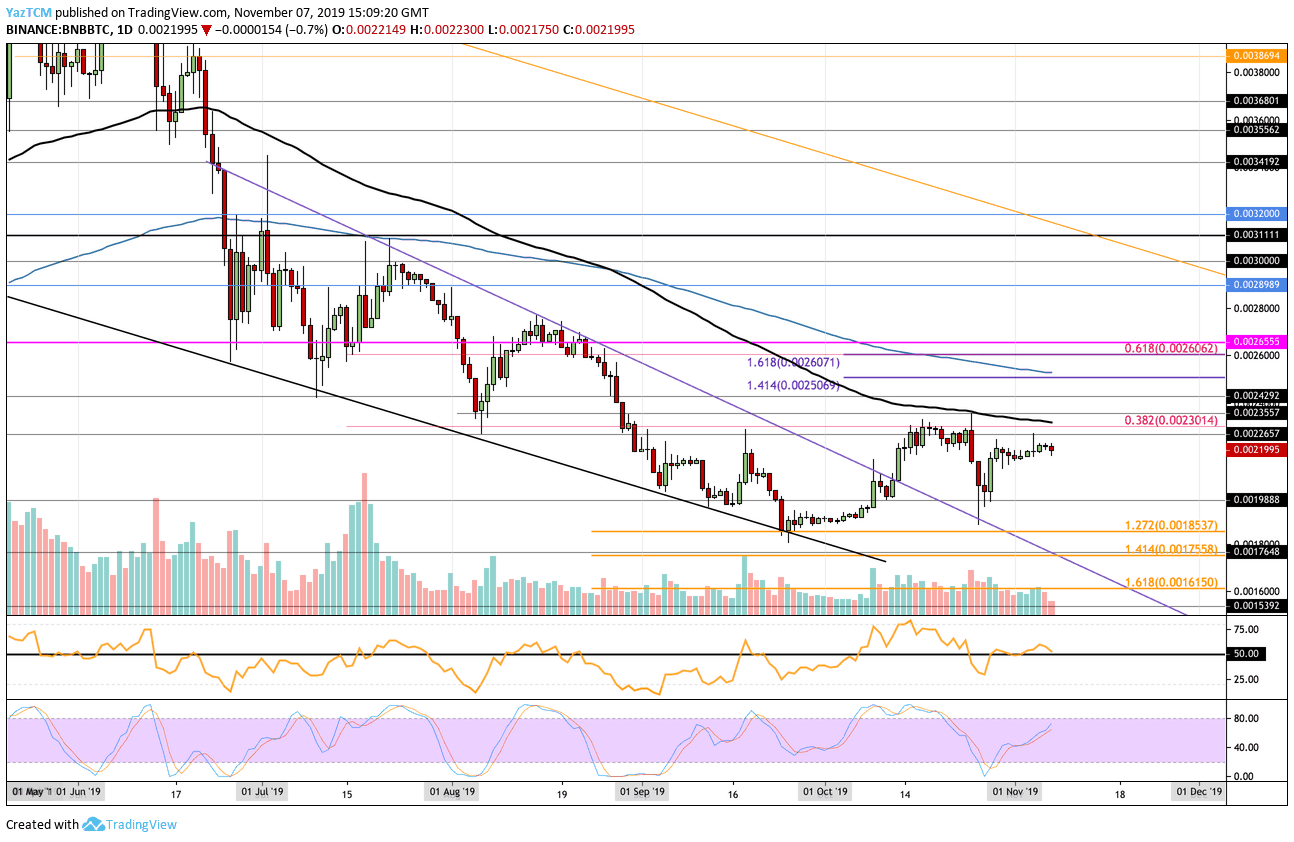
Looking at the BNB/BTC 1-Day Chart:
- Against Bitcoin, BNB rolled over from the resistance at 0.0023 BTC (provided by a bearish .382 Fib Retracement) but managed to find support at 0.001988 BTC. From there, the cryptocurrency rebounded higher as it trades at 0.0021995 BTC.
- From above: The nearest level of resistance lies at 0.0022 BTC. Above this, resistance is found at 0.0023 BTC (100-days EMA) 0.002355 BTC, 0.002492 BTC, and 0.00251 BTC (200-days EMA).
- From below: The nearest levels of support lie at 0.0021 BTC and 0.0020 BTC. Beneath this, support can be expected at 0.001988 BTC, 0.0019 BTC, 0.001853 BTC, and 0.0018 BTC.
- The trading volume remains high but is slowly diminishing.
- The RSI is trading at the 50 level which shows indecision within the market. For a bullish press, we must see the RSI rise above the 50 level to show that the bulls are in charge of the market momentum.
The post Binance Coin Price Analysis: Despite The Latest Bullish Binance Announcements, BNB Struggles At $21 appeared first on CryptoPotato.