Binance Coin Price Analysis: BNB Struggles Against the Rising Bitcoin but Targets $40 Again
Binance Coin keeps on performing splendidly as its price rose yet another 10.5% over the past week, posting a high of $39.59 before falling. BNB saw a small 2.13% price decline over the previous 24 hours of trading, bringing its price to about $37.19.
Binance Coin remains the seventh largest cryptocurrency by market capitalization with a market cap of around $5.24 billion. It has been on an impressive bull run that has seen the price increase by a total of 134% over the past three months.
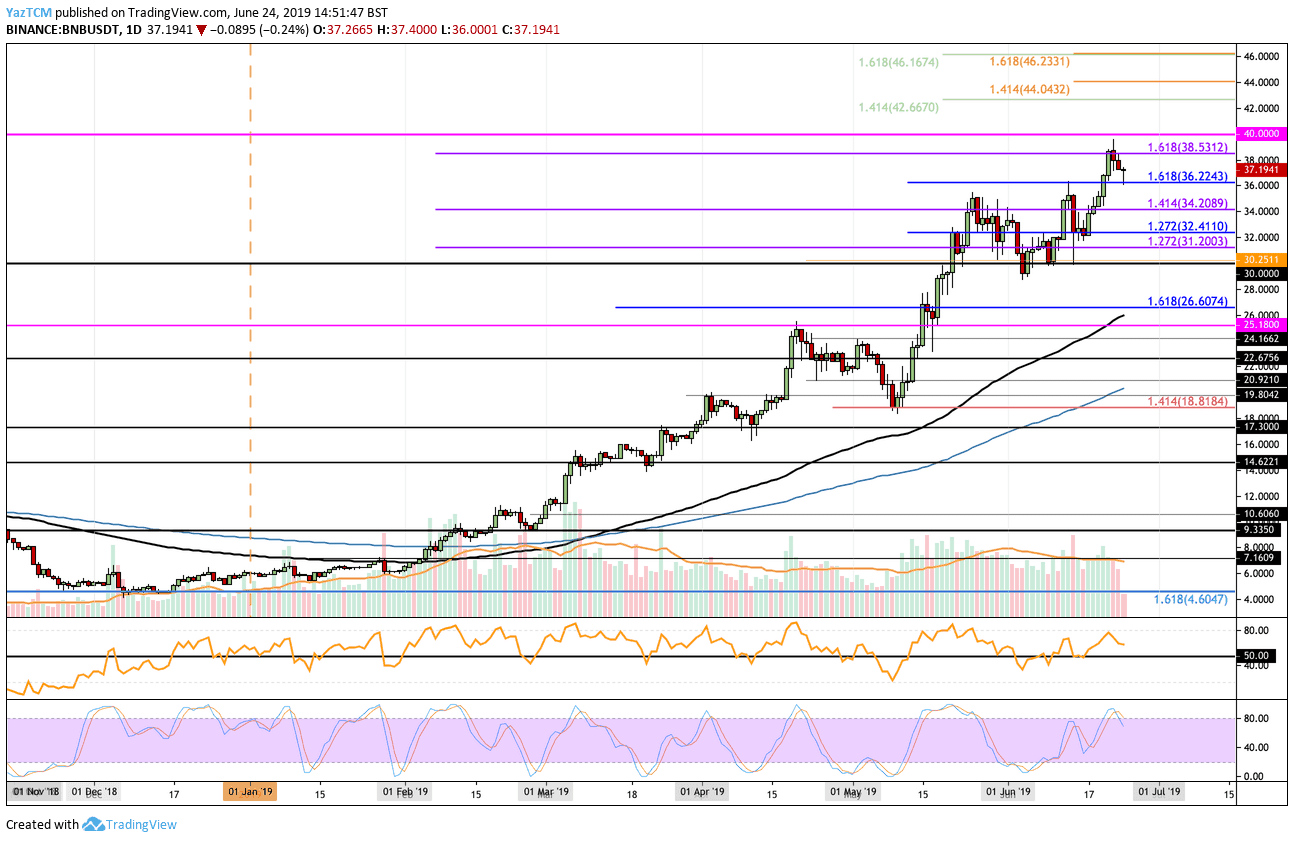
Looking at the BNB/USD 1-day chart:
- Since our previous BNB analysis, BNB has continued to climb higher against the dollar to reach the resistance located at the $38.53 level (provided by the medium-term 1.618 Fib extension). It was unable to close above this level and subsequently declined. The cryptocurrency’s price found support at the $36.22 level from which it bounced off.
- From above: The nearest level of resistance is found at $38.53. Additional resistance lies at the ATH price at $39.59 and at the $40 level. If the bulls continue above $40, higher resistance lies at $42, $42.66, $44.04, and $45. Above $45, strong resistance is expected at the $46.20 level.
- From below: The nearest level of support now lies at $36.22. Beneath this, support is found at $36, $35, $34.20, $32.41, $31.20, and $30. If the selling continues below $30, more support lies at $28, $26.60 and $25.18.
- The trading volume remains consistently high.
- The Stochastic RSI recently produced a bearish crossover signal in overbought conditions, which suggests that the market was overextended. If the RSI can remain above 50 on the retracement, we can expect the bulls to maintain their market momentum.
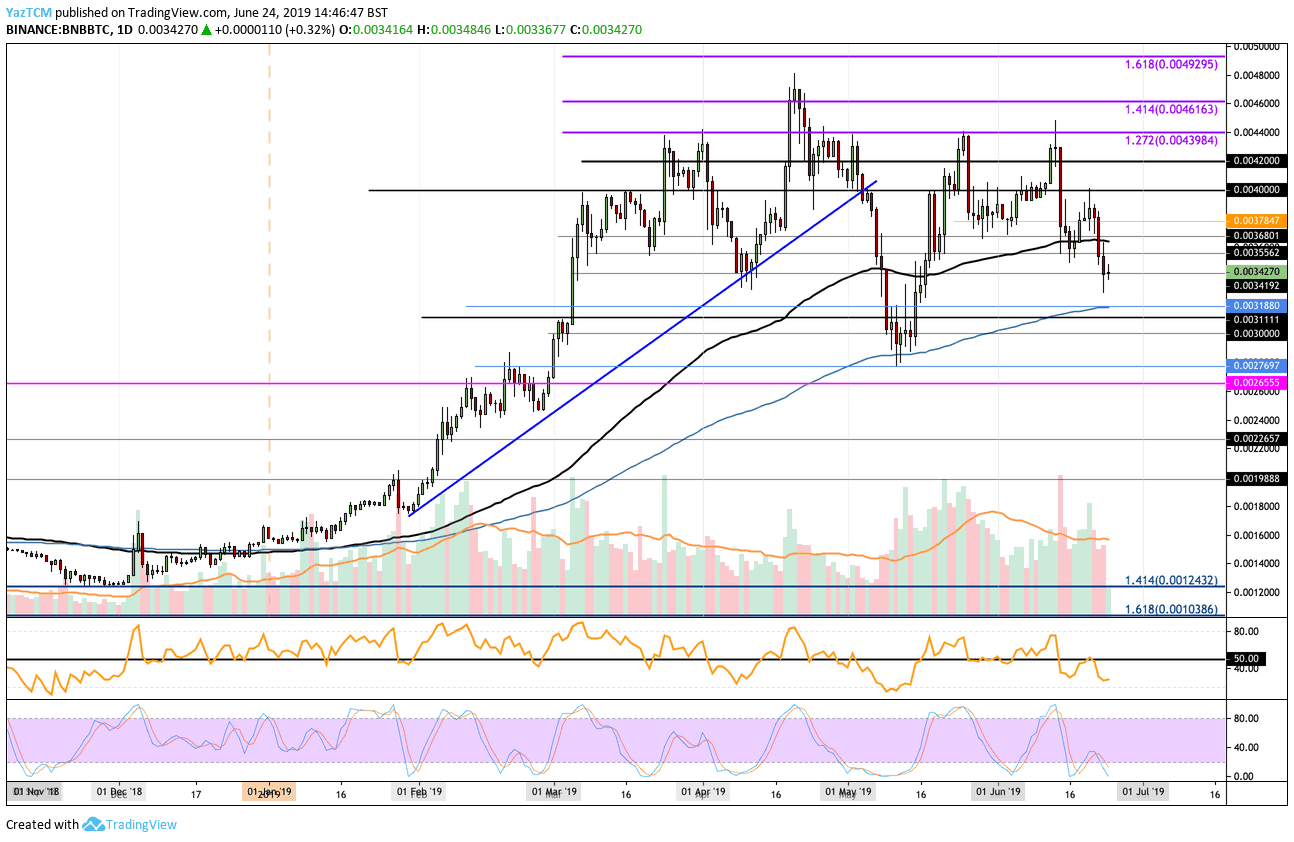
Looking at the BNB/BTC 1-day chart:
- Against Bitcoin, BNB has clearly been struggling. It made its way up to the 0.004 BTC level but failed to overcome this resistance. The cryptocurrency pulled back below the 100-day EMA to reach support at 0.003419 BTC.
- From above: The nearest level of resistance now lies at 0.00355 BTC. Above this, resistance is found at 0.0036 BTC (100 day EMA), 0.003580 BTC, 0.003780 BTC, 0.0038 BTC, and 0.0040 BTC. Above 0.004 BTC, further resistance lies at 0.0042 BTC and 0.0044 BTC.
- From below: The nearest level of support is 0.003419 BTC. Beneath this, additional support is found at 0.0033 BTC, 0.003188 BTC, 0.0030 BTC, and 0.002770 BTC.
- The June trading volume has remained relatively high.
- The Stochastic RSI continues to trade in oversold conditions, which indicates that the selling may be coming to an end. For a recovery above 0.004 BTC to be seen, we will need to see the RSI rise and break back above the 50 level.
The post Binance Coin Price Analysis: BNB Struggles Against the Rising Bitcoin but Targets $40 Again appeared first on CryptoPotato.