Binance Coin Price Analysis: BNB Is Heading To Its All-Time High (Again), Will It Hold This Time?
The surge continues within Binance Coin (BNB) after the market increased by another 25% over the past seven days, bringing the current price up to around $24.35.
The recent price increase had also allowed BNB to momentarily, climb above its previous ATH (all-time high) at $25.18. This is remarkable, as BNB was the first major altcoin to record a dollar-wise all-time high since 2017! However, the coin was unable to close above this level on the daily, and slightly fell, with yesterday’s drop to a low of $22.5 before recovering to the current price.
BNB continues to gain popularity ahead of the Matic Network IEO (initial exchange offering) on Binance Launchpad. IEOs, and especially the Launchpad had given birth to crypto projects including the popular BitTorrent Token. The Launchpad platform requires users to hold BNB in order to participate in the IEOs. Besides, Binance had recently announced on their Mainnet launch.
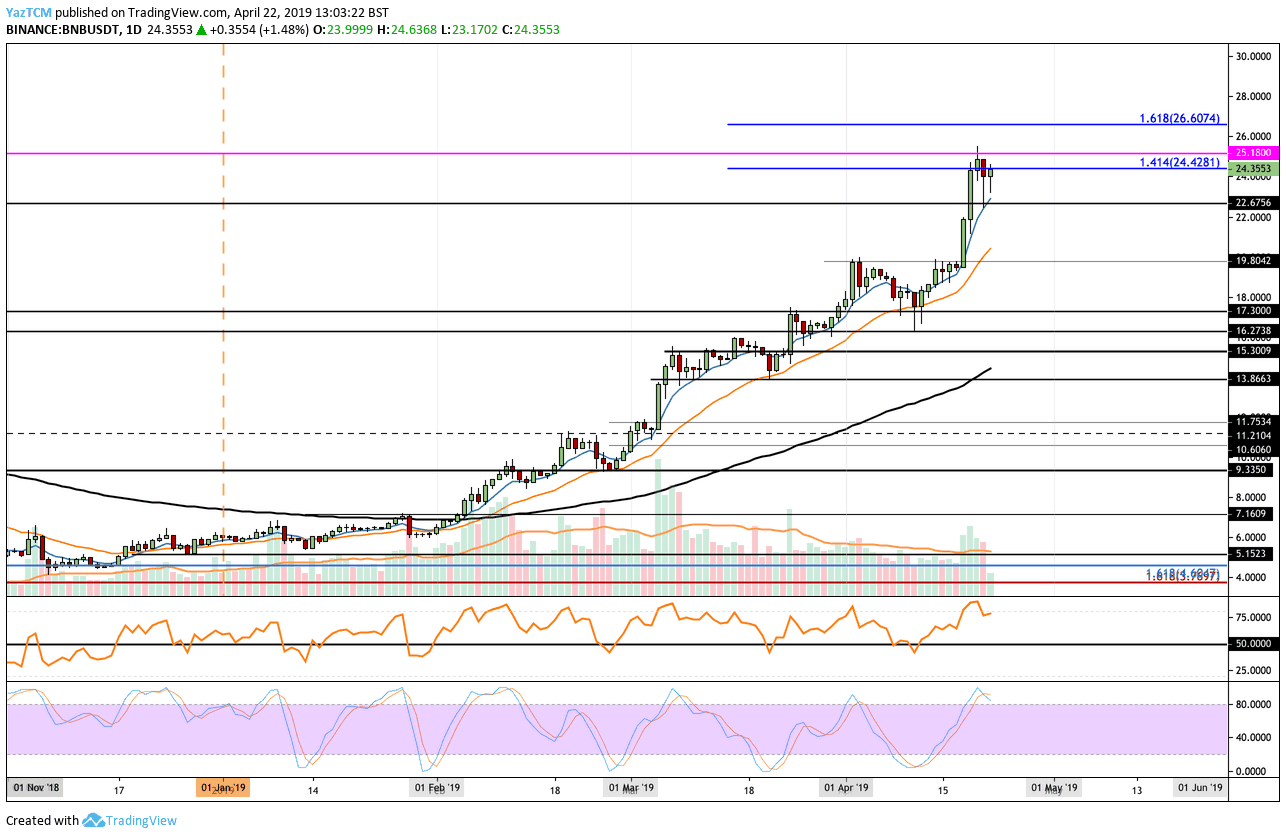
Looking at the BNB/USD 1-Day Chart:
- Since our last BNB/USD price analysis, we can see that BNB/USD has continued to surge further higher into our highlighted resistance area at $24.42, where lies a 1.414 Fibonacci Extension level. The coin had managed to break above the previous ATH at $25.18 but has been unable to close above this level, as of now.
- From above: If the bulls can push beyond the ATH at $25.18, we can expect immediate higher resistance at $26.00 followed with further resistance at $26.60, where lies the 1.618 Fibonacci Extension level. Resistance above lies at $27 before getting closer to the $30 area.
- From below: The nearest level of support toward the downside lies at $22.67 (pretty much the low of yesterday). Beneath this, we can expect further support at $21 and $20. If the coin drops beneath $20, strong support is then expected at $19.80 and $17.30.
- The trading volume has remained high and has increased over the past few days as interest gathers ahead of the latest IEO.
- However, the Stochastic RSI is in overbought areas and has recently crossed below which indicates a small pullback may be coming soon.
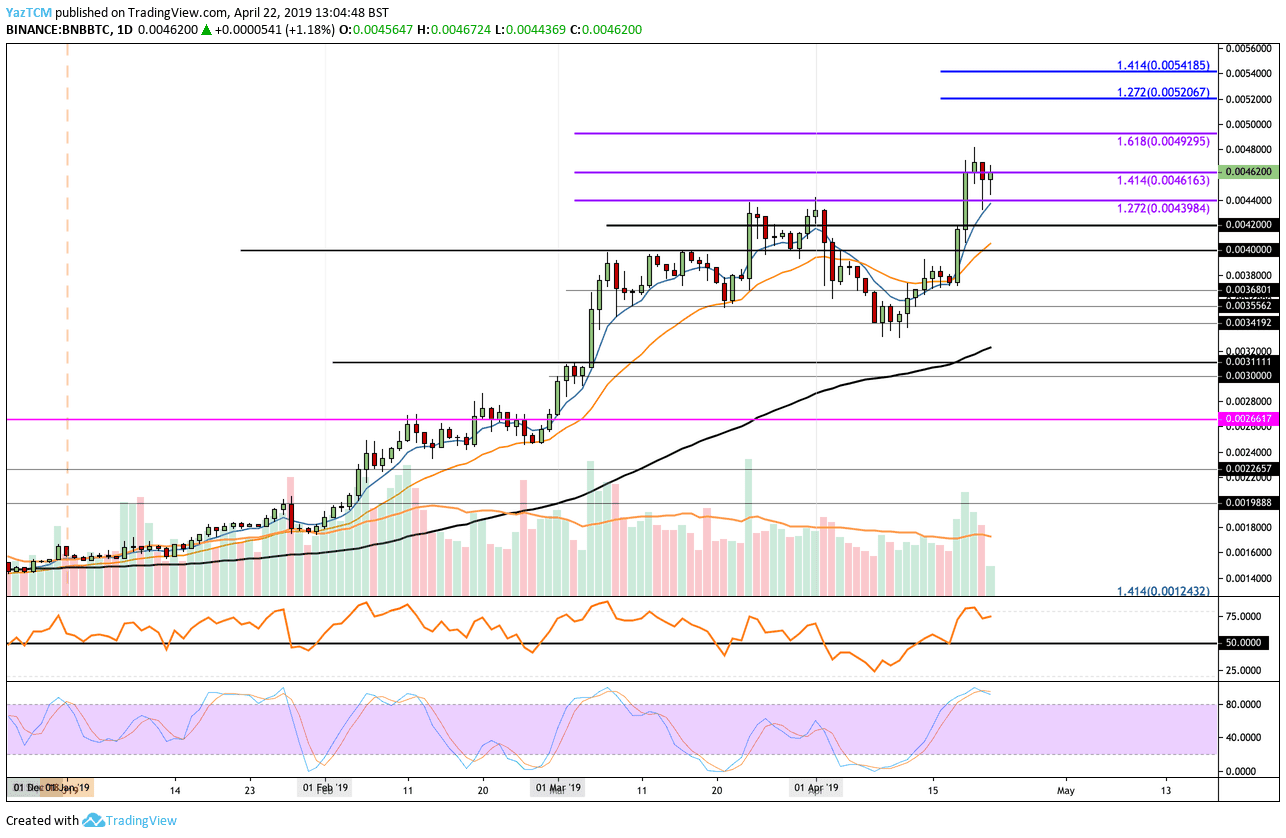
Looking at the BNB/BTC 1-Day Chart:
- Following our previous BNB/BTC analysis, we can see that the coin has also gained ground against Bitcoin. BNB/BTC had recently surged slightly above resistance at 0.0046 BTC where lies the 1.414 Fibonacci Extension level. The coin had managed to reach 0.0048 BTC before rolling over.
- From above: The nearest level of resistance above 0.0048 BTC lies at 0.00493 BTC where lies the 1.618 Fibonacci Extension level. If the buyers can continue to climb above the 0.005 BTC level, higher resistance can be anticipated at 0.0052 BTC (short term 1.272 Fib Extension) and 0.0054 BTC (short term 1.414 Fib Extension).
- From below: The nearest level of support lies at 0.0044 BTC. Beneath this, further support then lies at 0.0042 BTC and 0.0040 BTC.
- The Stochastic RSI has also initiated a crossover below which could suggest that a short term price drop is incoming. Furthermore, the RSI is nearing overbought conditions which also indicates a pullback may be expected.
The post Binance Coin Price Analysis: BNB Is Heading To Its All-Time High (Again), Will It Hold This Time? appeared first on CryptoPotato.


