Binance Coin Price Analysis: BNB Facing The $30 Price Range, New Highs Coming Up?
Binance Coin has been battling the $30 level as it currently trades at a price of $29.98. The cryptocurrency has seen a 7% increase over the past 7 days which allowed it to climb above the 100 days EMA. However, BNB’s next target to break lies at $30.
BNB remains the sixth-largest cryptocurrency with a market cap of $4.66 billion. The cryptocurrency has shown signs that it is ready to start another move up, providing $30 can be broken pretty quickly.
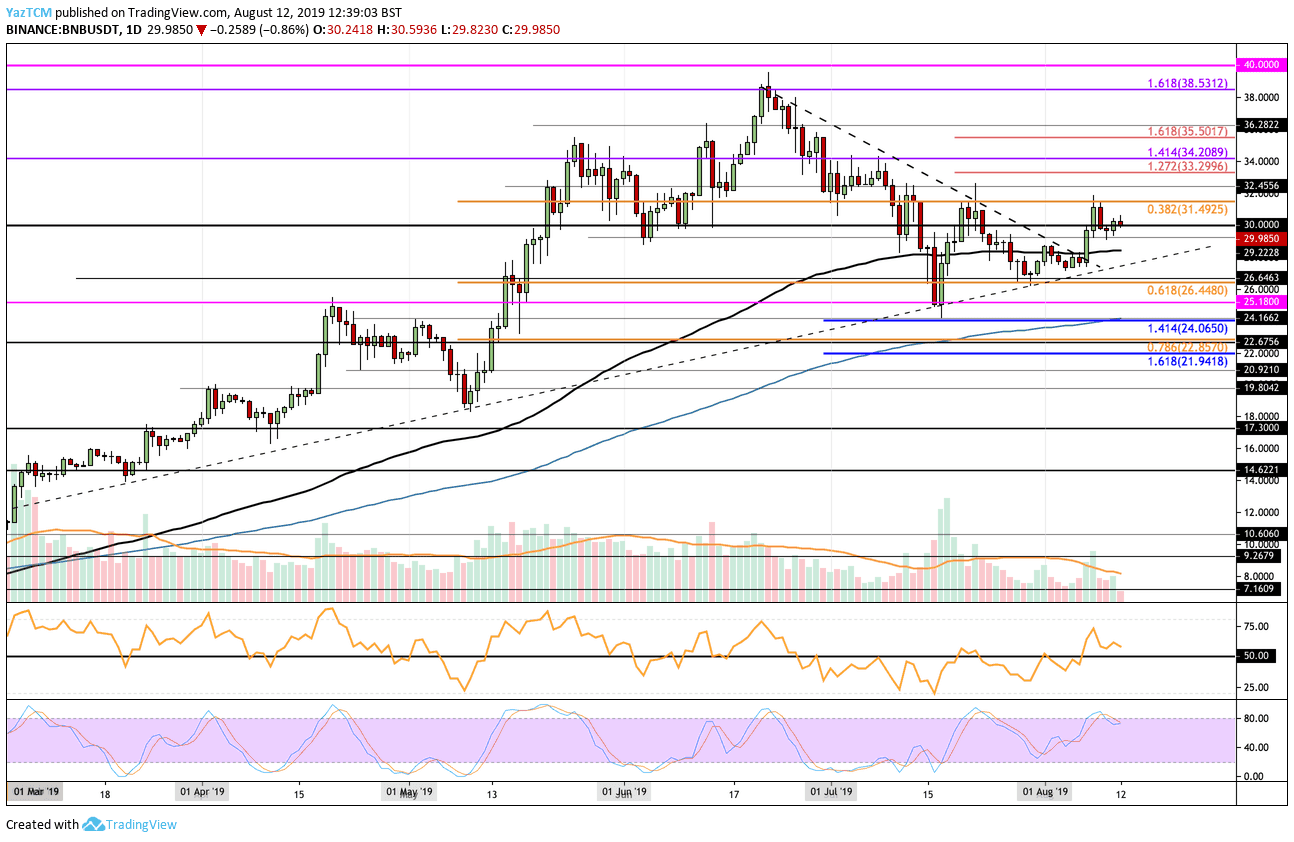
Looking at the BNB/USD 1-Day Chart:
- Since our previous BNB analysis, we can see that the highlighted resistance at $31.50 proved to be too strong for the bulls to overcome. The market has rolled over at this level to drop to where it currently trades at $29.98.
- From above: The nearest level of resistance lies at $30 and then at $31.50. If the bulls can break above $30, higher resistance lies at $32.45, $33.29, $34.20, and $35.50. Resistance above $36 lies at $38 and $38.50 – if the bulls can clear this level, they will be free to create fresh ATHs above $40.
- From below: The nearest level of support lies at the 100 days EMA which currently hovers around the $28.50 level. This is immediately followed up with further support in the long term rising trend line. Beneath this, further support is expected at $26.44, $25.18, and $24.06 (200 days EMA).
- The trading volume still remains relatively low and below the average level.
- The RSI has continued to remain above the 50 level which indicates that the bulls remain in control of the market momentum.
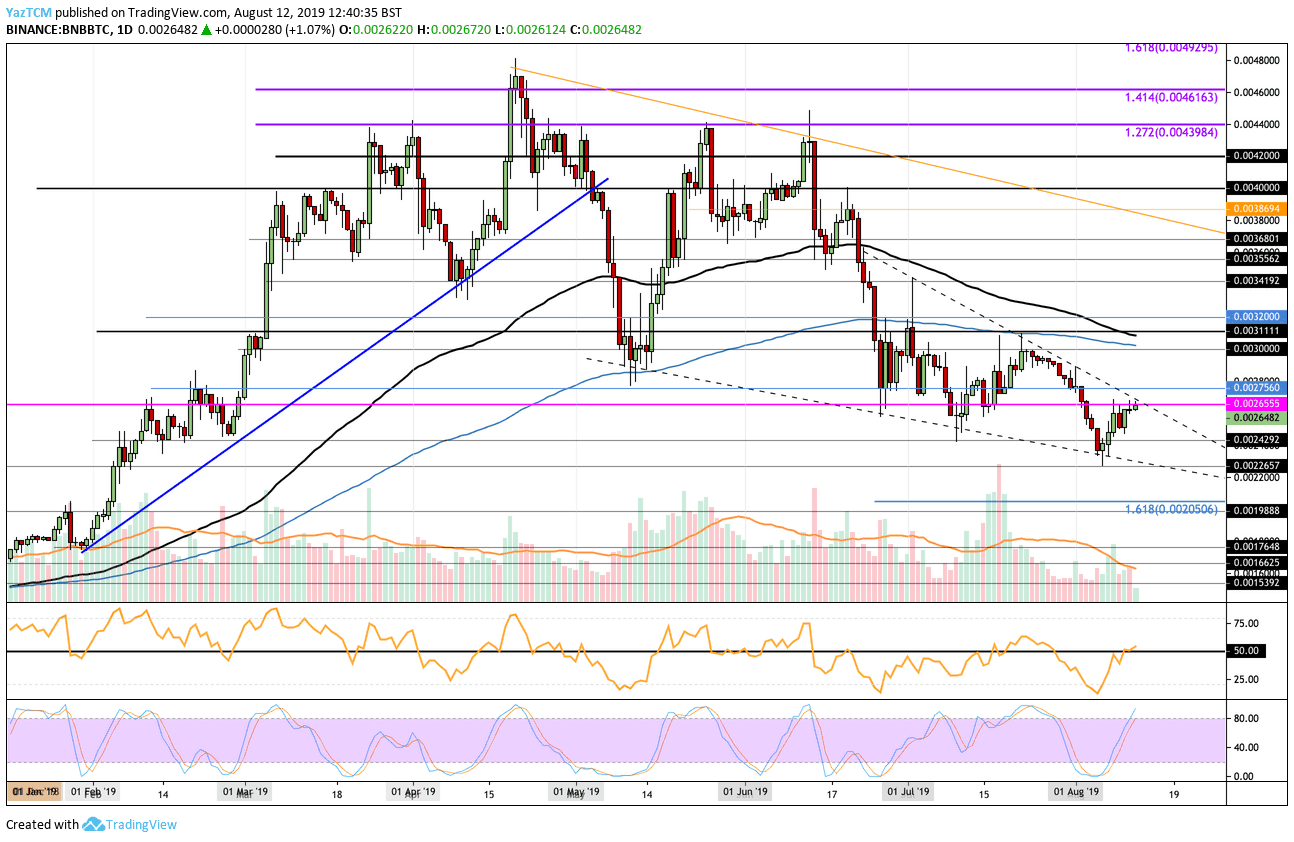
Looking at the BNB/BTC 1-Day Chart:
- Against Bitcoin, the resistance at 0.002655 BTC has continued to hold over the past few days. However, BNB keeps on trying to break above it.
- From above: If the bulls do break above the current resistance, higher resistance is located immediately at 0.002756 BTC and 0.0029 BTC. Above this, the next challenges are between 0.0030 BTC and 0.0031 BTC. This range contains both the 100 day EMA and 200 day EMA which has strengthened the expected resistance here.
- From below: The nearest level of support lies at 0.0026 BTC. Beneath this we can expect further support at 0.0025 BTC, 0.0023 BTC, and 0.002265 BTC. If the sellers drive the price lower, further support is located at 0.0022 BTC and 0.00205 BTC.
- The trading volume has started to show some signs of increasing.
- The RSI has managed to edge above the 50 level which shows that the bulls are still ready to continue higher.
The post Binance Coin Price Analysis: BNB Facing The $30 Price Range, New Highs Coming Up? appeared first on CryptoPotato.


